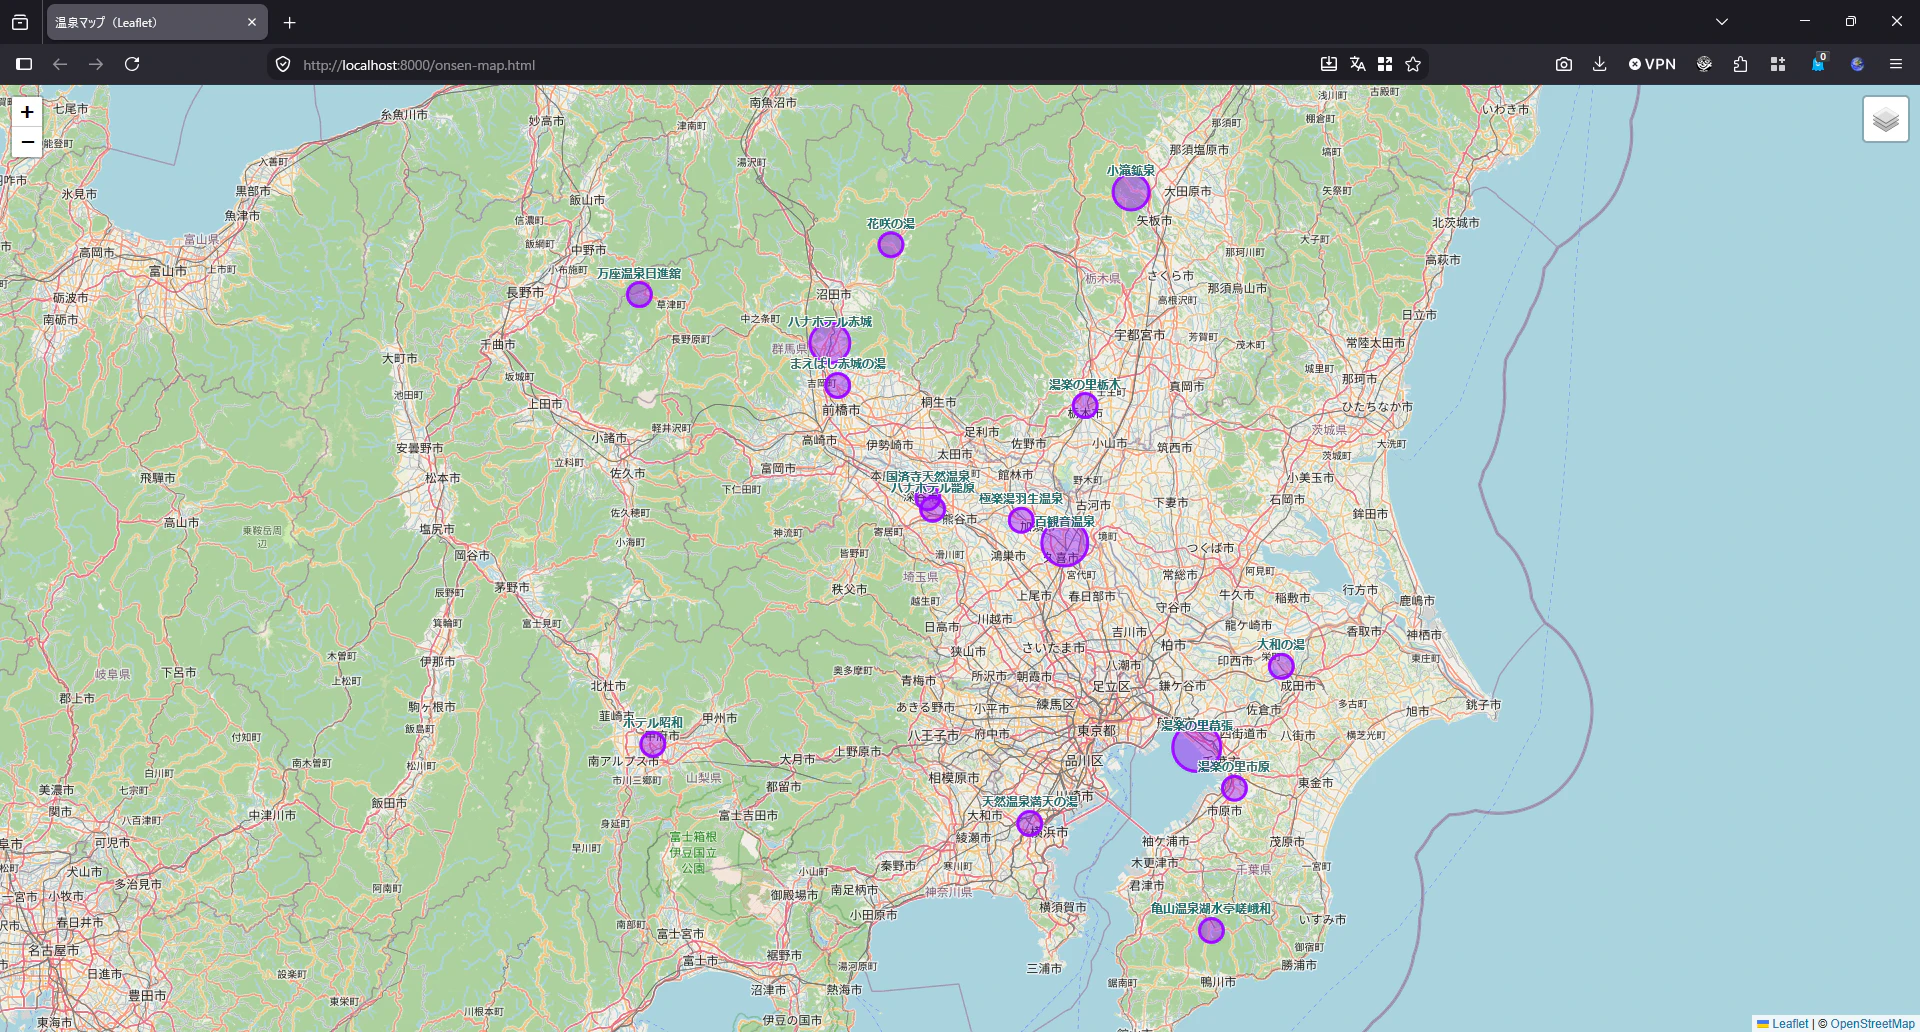
温泉♨が好きでよく出掛けるのですが、特にドライブ +温泉♨+呑み
 の旅で泊まった温泉や、単に出掛けた日帰り温泉なども含めて地図上に可視化してみました。#自分の忘備録39
可視化するもの
- 温泉に立ち寄った「日付」と「温泉」のリストをCSVファイルにしておく
- 「温泉」の「位置latlng」事前に調べてCSVファイルにしておく
- 温泉毎に立ち寄った回数に比例(最終的には回数のlog10に比例)した大きさの〇(Circle)を地図上に書く
- ポップアップで温泉に立ち寄った日付を表示
上記の2種類のCSVファイルのデータを連続して格納しておく(以下がCSVファイルonsen.csvの例)
onsen.csv
2026/01/01,湯楽の里市原
2026/04/24,湯楽の里栃木
...

湯楽の里市原,35.545123799509085, 140.1428688827864
湯楽の里栃木,36.39567687049678, 139.73289333901667
...
地図データと表示ライブラリを探す
ちょっと検索してみてお手軽かなと思ったのは、地図データにOpenStreetMapと表示ライブラリにJavaScriptライブラリLeafletを組み合わせて使用するのが良さそうなので、これにしました。
- OpenStreetMap Japan
- Leaflet - a JavaScript library for interactive maps
- データ受け渡しにはGeoJSONファイルを使用するが、GeoJSONフォーマットの図形などはPoint/LineString/Polygonのようで、Circleを直接描画する設定はないのでCircleはプログラムで書く
LeafletはCDNで使用するのが一般的かも知れませんが、今回はDownload - a JavaScript library for interactive mapsサイトから最新版Leaflet 1.9.4をダウンロードしておきます。
温泉マップ可視化プログラム作成
参考サイトなどを参照させて頂いて、以下のプログラムを作成しました。表示に使用するhtmlファイルにはjavascript/csも含めて1ファイルにまとめた。
htmlファイルをブラウザで開いて温泉マップを表示する形式ですが、ブラウザはCORS(Cross-Origin Resource Sharing)制限やローカルファイル制限があるので、ローカルサーバを使用して表示するようにします。
ファイル構成(配置)
Windows上の適当なディレクトリに配置します。
pythonはインストールされている前提。
C:\TEST\geojson\
  onsen-map.html
  onsen-map.cmd      ← いろいろ起動するcmdファイル

  dist\              ← ダウンロードしたLeaflet(leaflet.zip)を展開(最小限のファイルは以下の3ファイルで良さそう)
    leaflet.js
    leaflet.css
    images\
      layers.png

  resources\
    onsen.csv        ← 最初に作成しておくCSVデータ
    onsen.py         ← onsen.csvをonsen.geojsonに変換するpythonスクリプト
    onsen.geojson    ← 表示に使用するGeoJSONデータ
各ファイル内容
- C:\TEST\geojson\(ルートディレクトリ)
- onsen-map.html
- onsen-map.cmd
onsen-map.html
<!DOCTYPE html>
<html>
<head>
    <meta charset="UTF-8">
    <title>温泉マップ(Leaflet)</title>
    <link rel="stylesheet" href="/dist/leaflet.css"/>
    <style type="text/css">
        * {
            margin: 0;
            padding: 0;
            box-sizing: border-box;
        }
        #myMap {
            height: 100vh;
            width: 100%;
        }
        .onsen-label {
            background: transparent;
            border: none;
            box-shadow: none;
            font-weight: bold;
            color: #006666;  /* 文字色 */
            text-shadow: 1px 1px 0 #fff, -1px -1px 0 #fff, 1px -1px 0 #fff, -1px 1px 0 #fff;  /* 文字白縁 */
        }
        .onsen-label::before {  /* 吹き出し三角非表示 */
            display: none;
        }
    </style>
</head>
<body>
    <div id="myMap"></div>
    <script src="/dist/leaflet.js"></script>
    <script type="text/javascript">
        const osm = L.tileLayer('https://tile.openstreetmap.org/{z}/{x}/{y}.png', {
            attribution: '© <a href="http://www.openstreetmap.org/copyright">OpenStreetMap</a>'
        });

        var baseLayers = {
            "openstreetmap": osm,
        }

        var map = L.map('myMap', {
            center: [35.6812, 139.7671],
            zoom: 10,
            layers: [osm]
        })

        var LayerControl = L.control.layers(baseLayers).addTo(map);

        fetch("./resources/onsen.geojson")
            .then((response) => response.json())
            .then((data) => {
                var onsen = L.geoJSON(data, {
                    pointToLayer: function (feature, latlng) {
                        const radius = feature.properties.radius;
                        const color = feature.properties.color;

                        return L.circle(latlng, {
                            radius: radius,
                            color: color,
                            fillOpacity: 0.4
                        });
                    },
                    onEachFeature: function (feature, layer) {
                        if (feature.properties && feature.properties.name) {
                            layer.bindPopup(feature.properties.name + "<br>" + feature.properties.date.join("<br>"));  /*ポップアップ(日付)*/

                            layer.bindTooltip(feature.properties.name, {  /*ラベル*/
                                permanent: true,
                                direction: 'top',
                                className: 'onsen-label'
                            });
                        }
                    }
                });

                map.addLayer(onsen)
                LayerControl.addOverlay(onsen, "♨レイヤー")

                const bounds = onsen.getBounds();
                if (bounds.isValid()) {
                    map.fitBounds(bounds, { padding: [20, 20] });
                }
            });
    </script>
</body>
</html>
onsen-map.cmd
cd resources
call python onsen.py
cd ..

start /min python -m http.server 8000

start http://localhost:8000/onsen-map.html

pause
- C:\TEST\geojson\resources\(データディレクトリ)
- onsen.py
onsen.py
import csv
import json
import math


#----------------------------------------------------------------------------
def data(name, radius, color, latlng, date):
    return {
      'type': 'Feature',
      'properties': {
        'name': name,
        'radius': radius,
        'color': color,
        'date': date
      },
      'geometry': {
        'type': 'Point',
        'coordinates': latlng
      }
    }


#----------------------------------------------------------------------------
with open('onsen.csv', encoding='utf-8') as fd:
    rows = csv.reader(fd)
    rows = list(rows)
#print(rows)


#onsen.csv
#2026/01/01,湯楽の里市原
#湯楽の里市原,35.545123799509085, 140.1428688827864
onsen_num = {}
onsen_latlng = {}
onsen_date = {}

for row in rows:
    if len(row) == 2:  #date,name
        if row[1] not in onsen_num:
            onsen_num[row[1]] = 0
        onsen_num[row[1]] += 1
        if row[1] not in onsen_date:
            onsen_date[row[1]] = []
        onsen_date[row[1]].append(row[0])
    elif len(row) == 3:  #name,lat,lng
        onsen_latlng[row[0]] = [float(row[2]), float(row[1])]
#print(onsen_num, onsen_latlng)


geojson = {
  'type': 'FeatureCollection',
  'features': []
}

for name in onsen_latlng:
#    radius = 1000 * onsen_num[name]
    radius = 3000 * (1 + math.log10(onsen_num[name]))
#    radius = 3000 * (math.sqrt(onsen_num[name]))
    feature = data(name, radius, '#9900ff', onsen_latlng[name], onsen_date[name])
    geojson['features'].append(feature)


with open('onsen.geojson', 'w', encoding='utf-8') as fdout:
    print(json.dumps(geojson, indent=2, ensure_ascii=False), file=fdout)
温泉マップ表示
以下のcmdファイルの実行で、温泉マップがブラウザに表示されます。
cd C:\TEST\geojson
onsen-map.cmd     ← 温泉マップ開始(ローカルサーバとブラウザが起動する)
このマップを見て、どの辺に行ったのかの思い出にふけります