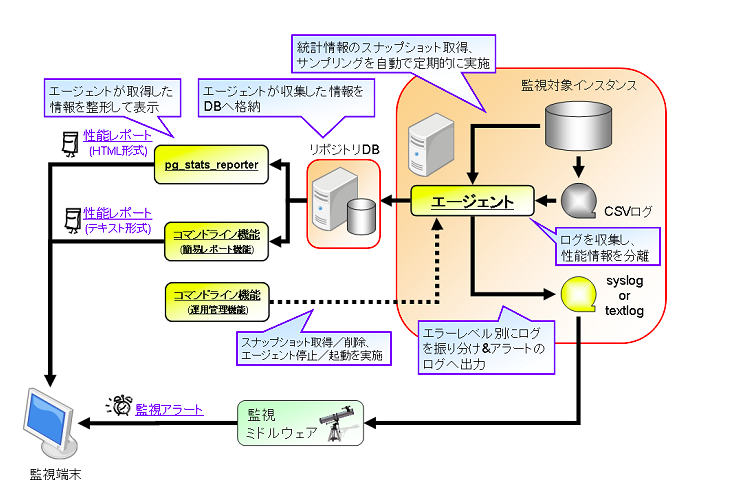
pg_statsinfo
DBの性能/ログ情報を収集する。
スナップショットの取得間隔はデフォルトで10分。
保持期間を経過した古いスナップショットの削除するなどの自動メンテナンス機能もある。
公式ホームページ
アーキテクチャ
レポート例(一部)
---------------------------------------------
STATSINFO Report (host: localhost.localdomain, port: 5432)
---------------------------------------------

----------------------------------------
/* Summary */
----------------------------------------
Database System ID   : 5846892200070150143
Host                 : localhost.localdomain
Port                 : 5432
PostgreSQL Version   : 9.2.3
Snapshot Begin       : 2013-02-20 13:50:00
Snapshot End         : 2013-02-20 14:10:00
Snapshot Duration    : 00:20:00
Total Database Size  : 34 MiB
Total Commits        : 216687
Total Rollbacks      : 0

----------------------------------------
/* Database Statistics */
----------------------------------------
Database Name              : postgres
Database Size              : 34 MiB
Database Size Increase     : 11 MiB
Commit/s                   : 180.588
Rollback/s                 : 0.000
Cache Hit Ratio            : 100.000 %
Block Read/s (disk+cache)  : 3797.221
Block Read/s (disk)        : 1.250
Rows Read/s                : 2952.493
Temporary Files            : 0
Temporary Bytes            : 0 MiB
Deadlocks                  : 0
Block Read Time            : 4.919 ms
Block Write Time           : 0.000 ms
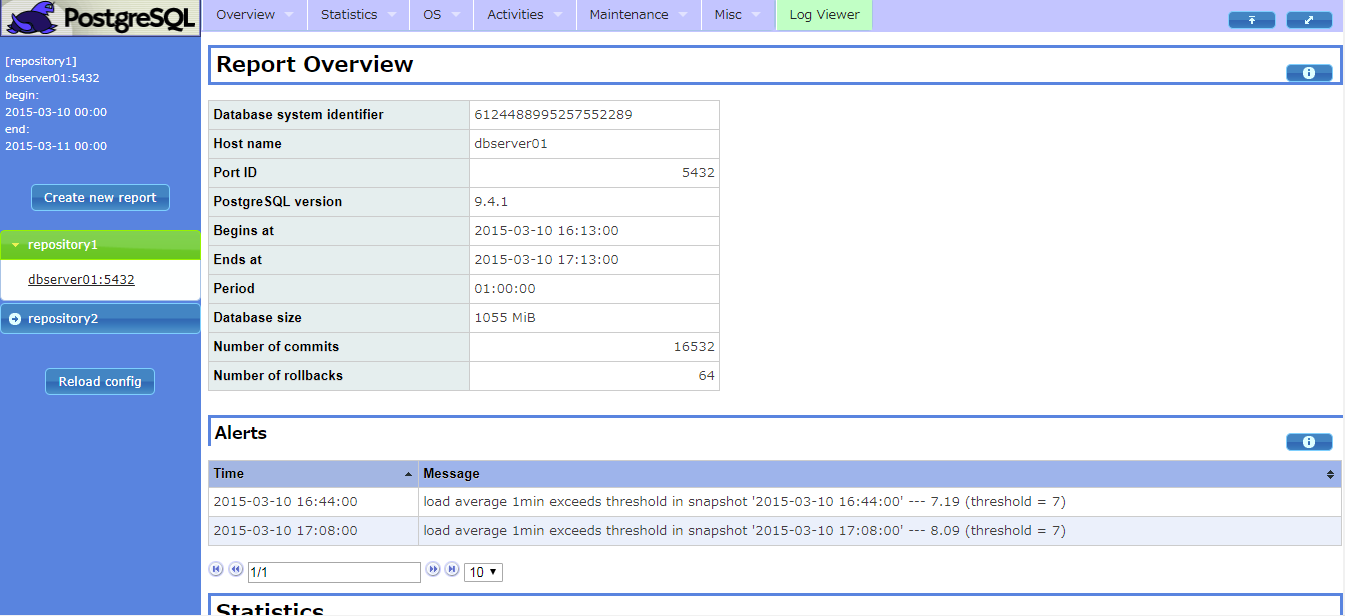
pg_stats_reporter
DBの性能/ログ情報を可視化する。
公式ホームページ
pg_stats_reporter 10(2019/2時点で最新)
レポート例(一部)
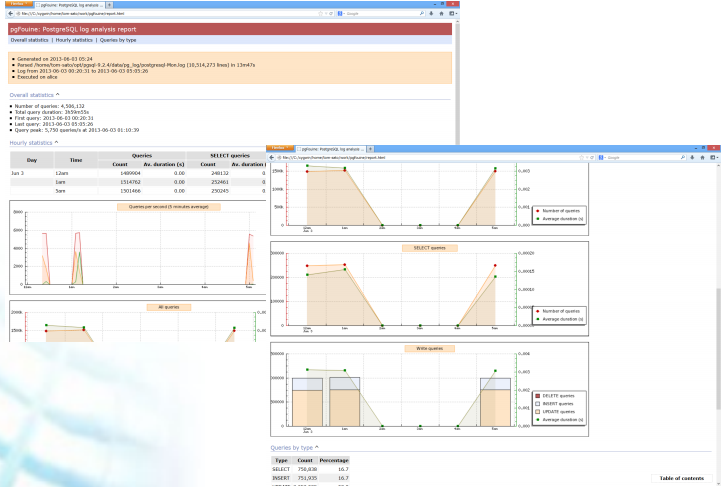
pgFouine
PostgreSQLのログから問題SQLを抽出する。
公式ホームページ
レポート例(一部)
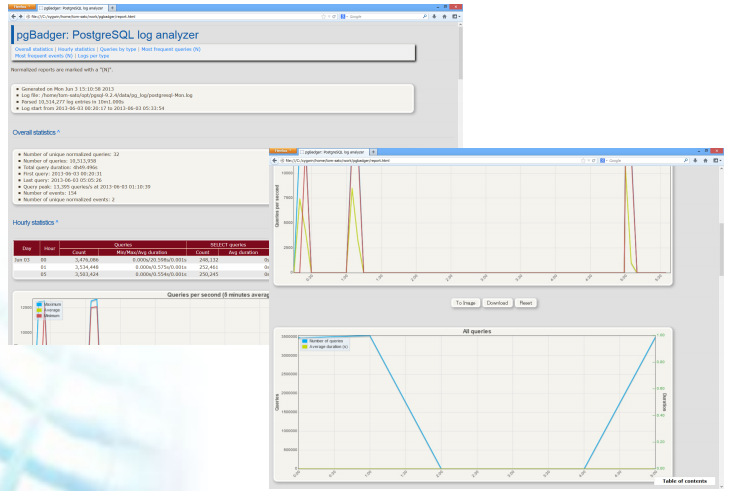
pgBadger
pgFouineとほぼ同じツール。こっちの方が新しくておススメ。
公式ホームページ
レポート例(一部)
pg_stat_statements
SQLの実行情報を確認する。
PostgreSQLの標準機能。
公式ホームページ
PostgreSQL 10.5文書 pg_stat_statements
レポート例(一部)
bench=# SELECT pg_stat_statements_reset();

$ pgbench -i bench
$ pgbench -c10 -t300 bench

bench=# \x
bench=# SELECT query, calls, total_time, rows, 100.0 * shared_blks_hit /
               nullif(shared_blks_hit + shared_blks_read, 0) AS hit_percent
          FROM pg_stat_statements ORDER BY total_time DESC LIMIT 5;
-[ RECORD 1 ]---------------------------------------------------------------------
query       | UPDATE pgbench_branches SET bbalance = bbalance + $1 WHERE bid = $2;
calls       | 3000
total_time  | 9609.00100000002
rows        | 2836
hit_percent | 99.9778970000200936
-[ RECORD 2 ]---------------------------------------------------------------------
query       | UPDATE pgbench_tellers SET tbalance = tbalance + $1 WHERE tid = $2;
calls       | 3000
total_time  | 8015.156
rows        | 2990
hit_percent | 99.9731126579631345
-[ RECORD 3 ]---------------------------------------------------------------------
query       | copy pgbench_accounts from stdin
calls       | 1
total_time  | 310.624
rows        | 100000
hit_percent | 0.30395136778115501520
-[ RECORD 4 ]---------------------------------------------------------------------
query       | UPDATE pgbench_accounts SET abalance = abalance + $1 WHERE aid = $2;
calls       | 3000
total_time  | 271.741999999997
rows        | 3000
hit_percent | 93.7968855088209426
-[ RECORD 5 ]---------------------------------------------------------------------
query       | alter table pgbench_accounts add primary key (aid)
calls       | 1
total_time  | 81.42
rows        | 0
hit_percent | 34.4947735191637631
auto_explain
SQLの実行計画を確認する。
PostgreSQLの標準機能。
公式ホームページ
PostgreSQL 10.5文書 auto_explain
レポート例(一部)
LOG:  duration: 3.651 ms  plan:
  Query Text: SELECT count(*)
              FROM pg_class, pg_index
              WHERE oid = indrelid AND indisunique;
  Aggregate  (cost=16.79..16.80 rows=1 width=0) (actual time=3.626..3.627 rows=1 loops=1)
    ->  Hash Join  (cost=4.17..16.55 rows=92 width=0) (actual time=3.349..3.594 rows=92 loops=1)
          Hash Cond: (pg_class.oid = pg_index.indrelid)
          ->  Seq Scan on pg_class  (cost=0.00..9.55 rows=255 width=4) (actual time=0.016..0.140 rows=255 loops=1)
          ->  Hash  (cost=3.02..3.02 rows=92 width=4) (actual time=3.238..3.238 rows=92 loops=1)
                Buckets: 1024  Batches: 1  Memory Usage: 4kB
                ->  Seq Scan on pg_index  (cost=0.00..3.02 rows=92 width=4) (actual time=0.008..3.187 rows=92 loops=1)
                      Filter: indisunique