環境
- macOS High Sierra 10.13.2
- python 3.6.3
インストール
公式の
https://superset.incubator.apache.org/installation.html#getting-started
の通りで,特に問題なかった.
設定ファイルは/usr/local/lib/python3.6/site-packages/supersetの下にある.
動機
- 年末年始で暇だし何かしたいなぁ,と思って
- 去年読んだこの本とかこの本を思い出して
- 国連(国連経済社会局 人口部)にはこんな感じのサイトがあったり,フランスの国立人口統計学研究所にはこんなサイトがあったりするのを見て
データ
-
estat
国勢調査(2000年,2005年,2010年,2015年)の結果を利用. -
国立社会保障・人口問題研究所(社人研)
2010年の国勢調査をベースにした,2040年までの5年おきの地域別人口推計を利用.
この記事を編集している間に,estatがリニューアルされたようで,そこで社人研のデータが使えるようになれば,以下の内容もestatのダッシュボードで見えるようにできるはず...
可視化例
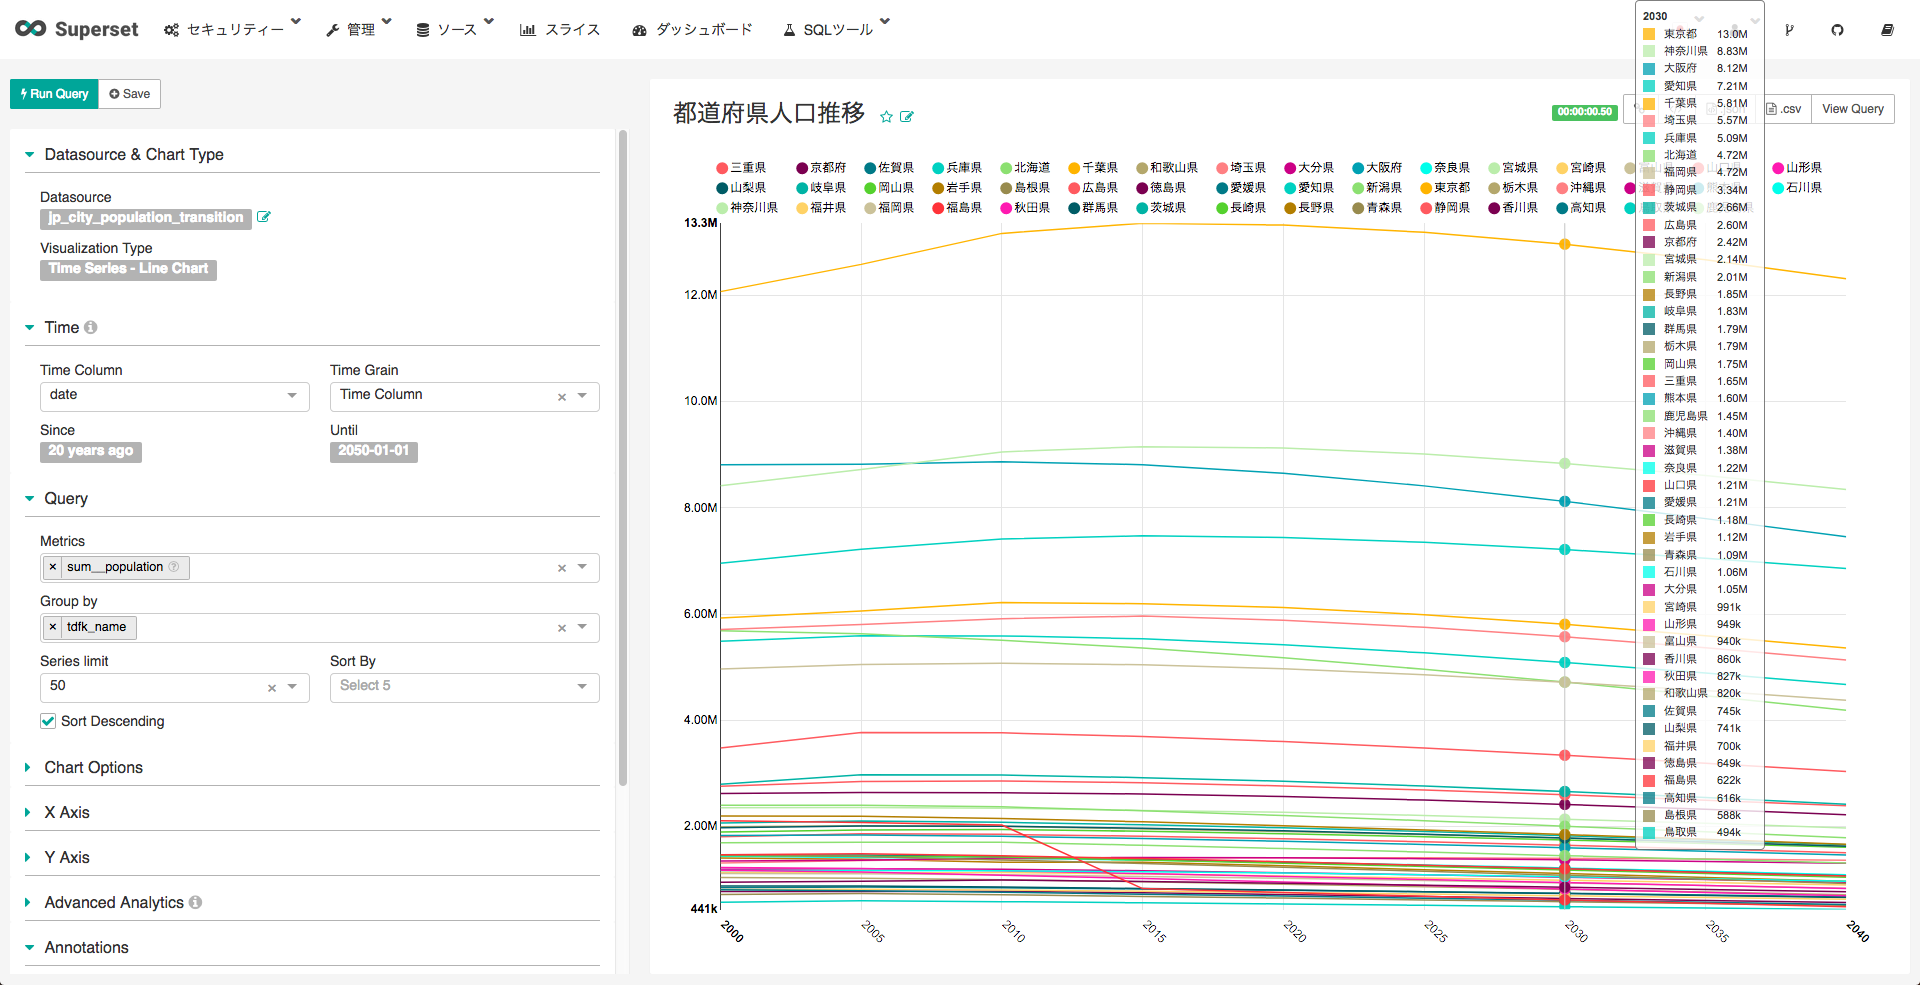
- 都道府県別の人口推移
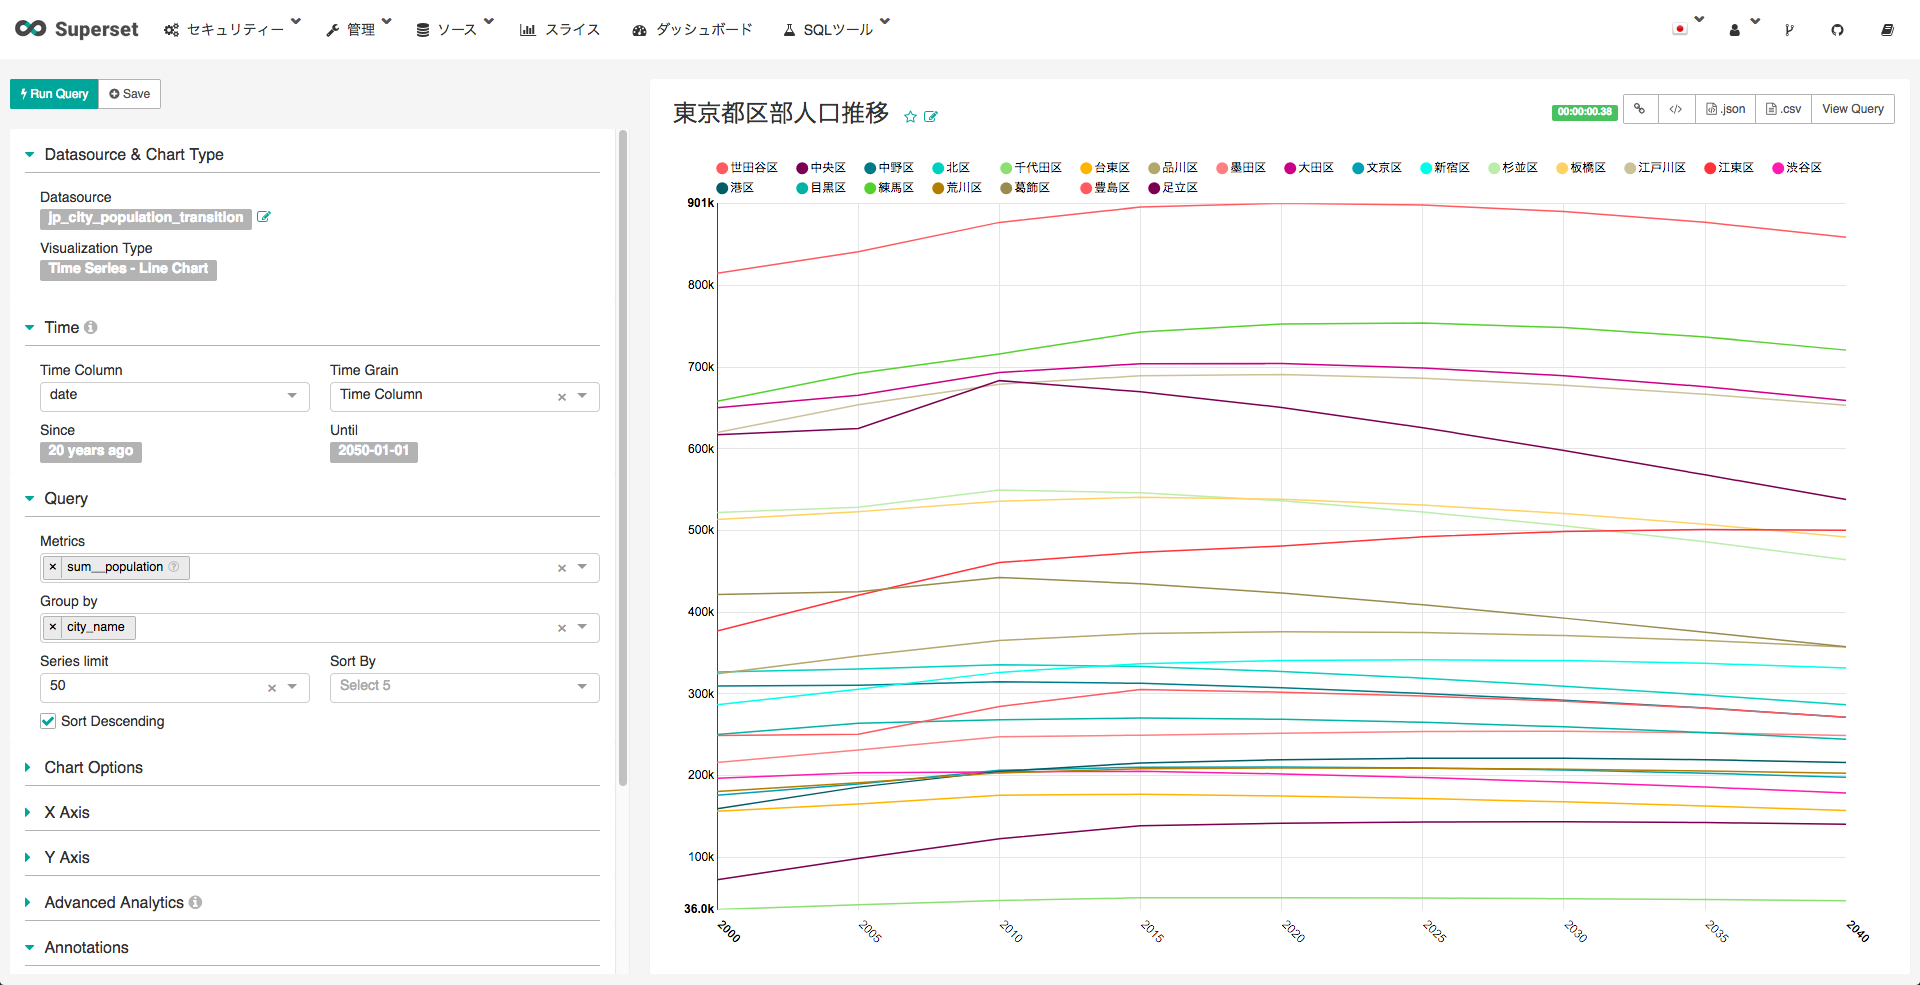
- 東京都特別区部の人口推移
足立区が結構減っていく...
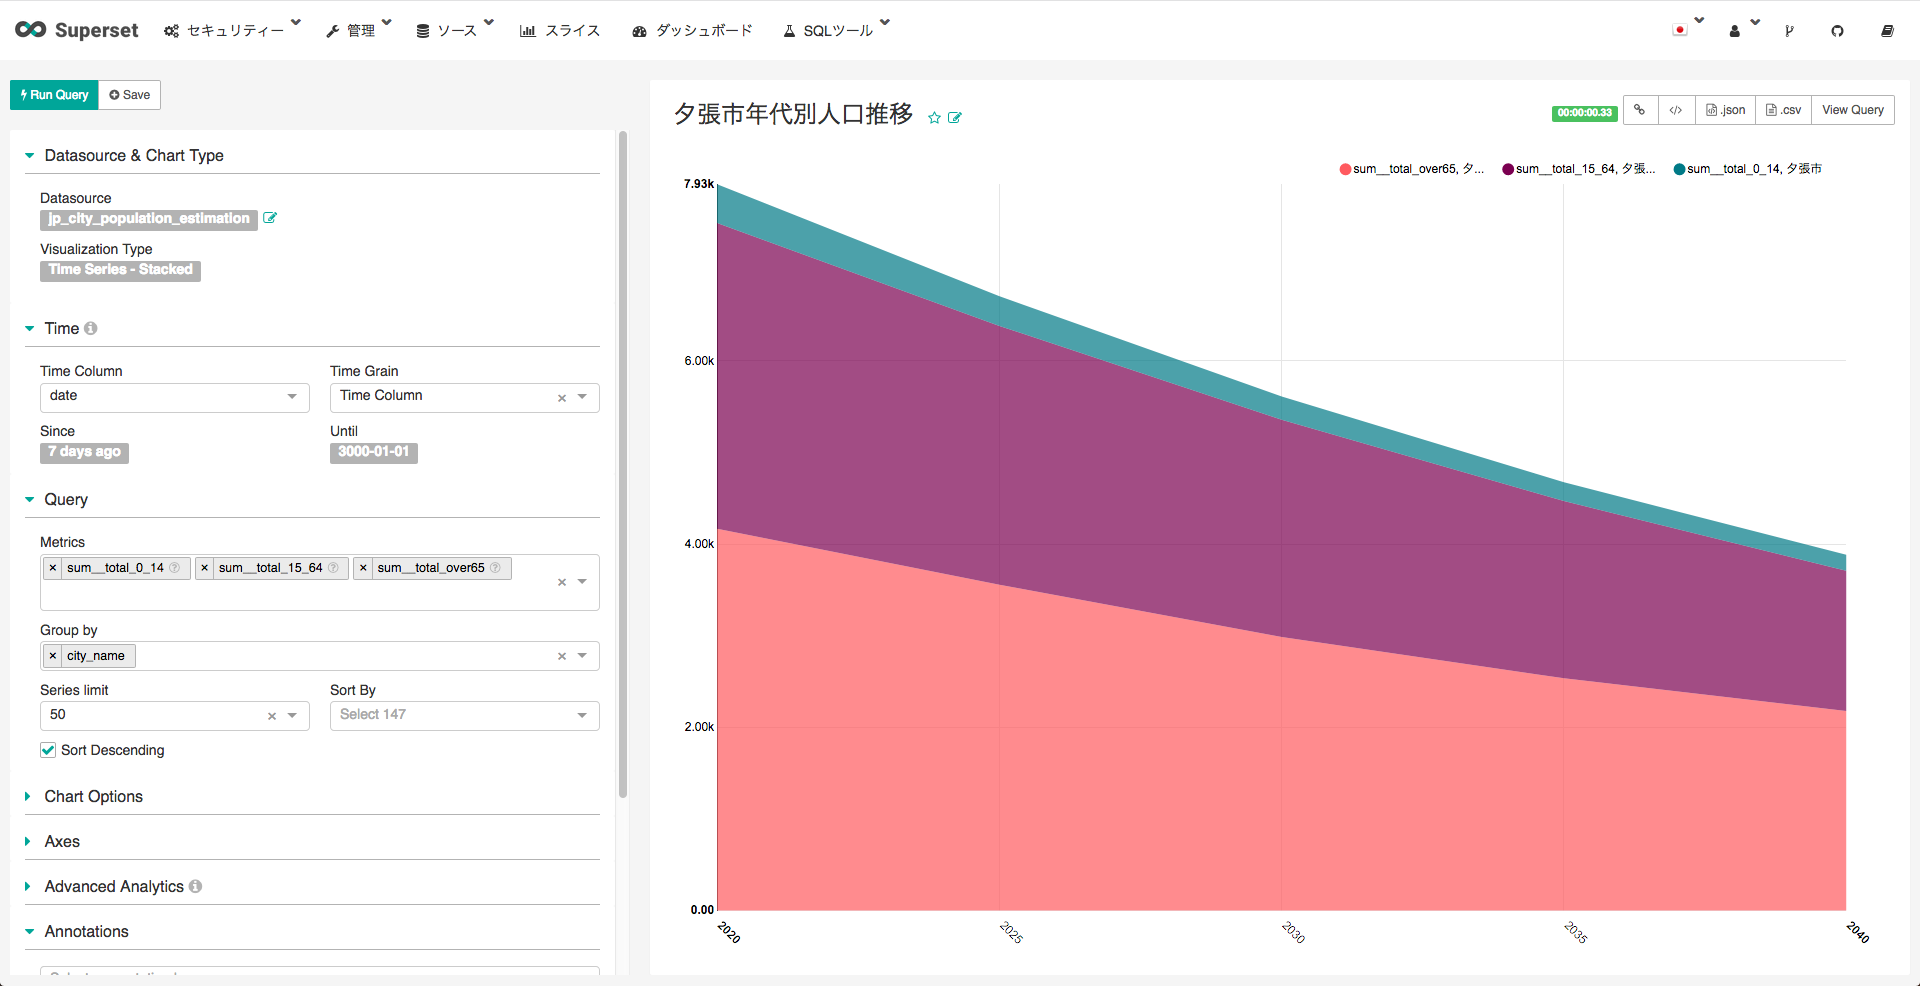
- 夕張市の年齢別人口推移
夕張市を選んだのは,上で引用した本の中で触れられていたので,可視化してみようかと...子供の数に比べて高齢者の数が大きく減っていくのか...
感想
- superset自体の扱いは簡単.
- 国勢調査の結果は,どれを使えばいいのか最初は結構迷った(例えば特定の都道府県の人口推移が,別ファイルになっているのかと思いきや,時系列でまとめられたファイルがあったので.インタフェースがリニューアルされたことで解消されているのか?)
まだできていないこと
- 日本地図へのmapping.ここを参考にすればいいのかな.


