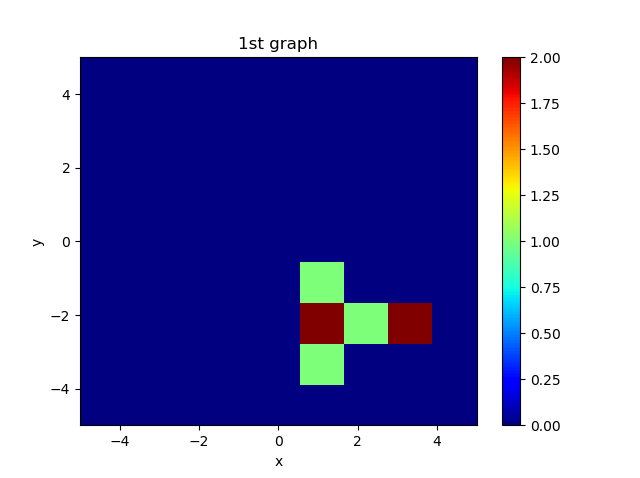
2次元のヒストグラムをpythonで描画する方法は、MatplotlibやOpenCVを用いたものが有名です。
本記事ではMatplotlibで2次元ヒストグラムを作成した際に、ヒストグラムを2次元配列としてテキストファイルに書き出す方法をメモしておきます。
[Python] Matplotlibで2次元のヒストグラム
Matplotlibを用いて2次元のヒストグラム画像を作成する方法については@supersaiakujinさんの記事がおすすめです。
[Python]Matplotlibで2次元ヒストグラムを作成する方法
概要は、「Matplotlib」ライブラリの 「hist2d」関数 に元データとなる2つのnumpy配列を渡すことで2次元ヒストグラムを作成しています。
元データとなる2つのnumpy配列はそれぞれ、「x座標のみの配列」、「y座標のみの配列」を作成する必要があることは注意が必要です。

このような2次元ヒストグラムは以下のサンプルプログラムで書けます。
import numpy as np
import matplotlib.pyplot as plt
import matplotlib.cm as cm

# 元データ
x = (1.1,1.1,3.2,3.1,1.1,2.1,1.1)
y = (-1.1,-2.1,-2.1,-2.1,-3.1,-2.1,-2.1)

# グラフ描画のための前準備
fig = plt.figure()
ax = fig.add_subplot(111)

# ヒストグラム作成 hist2d(配列,配列, 描画範囲指定(下限、上限、分割数), カラーバーの色合い指定)
H = ax.hist2d(x,y, bins=[np.linspace(-5,5,10),np.linspace(-5,5,10)], cmap=cm.jet)
ax.set_title('1st graph')
ax.set_xlabel('x')
ax.set_ylabel('y')
fig.colorbar(H[3],ax=ax)
plt.show()
2次元ヒストグラムの値を配列で書き出す
2次元ヒストグラムの値を配列としてテキストファイルやcsvに書き出すにはnumpyのsave関数が便利です。
# ヒストグラム作成 hist2d(配列,配列, 描画範囲指定(下限、上限、分割数), カラーバーの色合い指定)
H = ax.hist2d(x,y, bins=[np.linspace(-5,5,10),np.linspace(-5,5,10)], cmap=cm.jet)
np.savetxt("2Dhist-array.txt", H[0], fmt = "%s")
hist2dの返り値をMatplotlibの公式マニュアルで確認すると1つ目の返り値がヒストグラムの値であることが分かります。
そのためH[0]を取り出します。
fmt = "%s"は文字列でフォーマット指定しています。
| hist2d | |
|---|---|
| H[0] | ヒストグラムの値(2次元配列) |
| H[1] | x軸の分割値(1次元配列) |
| H[2] | y軸の分割値(1次元配列) |
| H[3] | カラーバー情報(QuadMesh) |
| Matplotlib.pyplot.hist2d |
# ヒストグラム作成 hist2d(配列,配列, 描画範囲指定(下限、上限、分割数), カラーバーの色合い指定)
H = ax.hist2d(x,y, bins=[np.linspace(-5,5,10),np.linspace(-5,5,10)], cmap=cm.jet)
print(H[0])
>>>[[0. 0. 0. 0. 0. 0. 0. 0. 0.]
 [0. 0. 0. 0. 0. 0. 0. 0. 0.]
 [0. 0. 0. 0. 0. 0. 0. 0. 0.]
 [0. 0. 0. 0. 0. 0. 0. 0. 0.]
 [0. 0. 0. 0. 0. 0. 0. 0. 0.]
 [0. 1. 2. 1. 0. 0. 0. 0. 0.]
 [0. 0. 1. 0. 0. 0. 0. 0. 0.]
 [0. 0. 2. 0. 0. 0. 0. 0. 0.]
 [0. 0. 0. 0. 0. 0. 0. 0. 0.]]
出力される配列を見る限り、y軸に沿って1次元配列が生成されています。
今回のコードをまとめました。
import numpy as np
import matplotlib.pyplot as plt
import matplotlib.cm as cm

# 元データ
x = (1.1,1.1,3.2,3.1,1.1,2.1,1.1)
y = (-1.1,-2.1,-2.1,-2.1,-3.1,-2.1,-2.1)

# グラフ描画のための前準備
fig = plt.figure()
ax = fig.add_subplot(111)

# ヒストグラム作成 hist2d(配列,配列, 描画範囲指定, カラーバーの色合い指定)
H = ax.hist2d(x,y, bins=[np.linspace(-5,5,10),np.linspace(-5,5,10)], cmap=cm.jet)
ax.set_title('1st graph')
ax.set_xlabel('x')
ax.set_ylabel('y')
fig.colorbar(H[3],ax=ax)
plt.show()

# 2Dヒストグラムのテキストファイルへの書き出し
np.savetxt("2Dhist-array.txt", H[0], fmt = "%s")