x-meansとは,k-meansの繰り返しとBICによるクラスターの分割(or処理停止)基準によって,最適なクラスター数を決定するアルゴリズムです.
この記事ではpyclusteringというライブラリでx-meansを使う方法を紹介します.
k-means系まとめ
- k-means:クラスターの重心からの二乗誤差を最小化.
- k-medoids:クラスターのmedoid(クラスターに属する点で,非類似度の総和が最小となる点)からの非類似度の総和が最小となるようにEMの手続きを行う.
- x-means:BICに基づいてクラスタの分割を制御.
- g-menas:データが正規分布に基づくと仮定して,アンダーソン・ダリング検定によってクラスタの分割を制御.
- gx-means:上二つの拡張.
- etc(pyclusteringのreadme参照.色々ある)
クラスター数の判定
データを人間が目で見てすぐにクラスター数がわかるならいいのですが,そんなのは稀なので,定量的な判定方法が欲しいところ.
sklearnのチートシートによれば,
- MeanShift
- VBGMM
が推奨されている.
も有用ですが,綺麗にエルボー(グラフがガクッとなる点)が出ることが経験上少なく,クラスター数に迷うことが多かったです.
全自動でクラスター数とクラスタリングをしてくれる方法として,x-meansがあります.
以下,x-meansを含む様々なクラスタリング手法を収録しているライブラリ「pyclustering」の使い方.
pyclusteringの使い方
pyclusteringは,クラスタリングアルゴリズムを集めたライブラリで,pythonとC++の両方で実装されています.
インストール
依存するパッケージ:scipy, matplotlib, numpy, PIL
pip install pyclustering
x-means使用例
x-meansは,k-meansにおけるEMステップに加えて,新たなステップ:あるクラスターが正規分布2つで表されるのと1つで表されるのとどちらが適切か,を判定し,2つが適切な場合はクラスターを2つに分ける,という操作がなされます.
以下,jupyter notebook使用.
import numpy as np
import pandas as pd
import matplotlib.pyplot as plt
from sklearn import cluster, preprocessing

# Wineのデータセット
df_wine_all=pd.read_csv('https://archive.ics.uci.edu/ml/machine-learning-databases/wine/wine.data', header=None)
# 品種(0列、1~3)と色(10列)とプロリンの量(13列)を使用する
df_wine=df_wine_all[[0,10,13]]
df_wine.columns = [u'class', u'color', u'proline']

# データの整形
X=df_wine[["color","proline"]]
sc=preprocessing.StandardScaler()
sc.fit(X)
X_norm=sc.transform(X)

# プロット
%matplotlib inline

x=X_norm[:,0]
y=X_norm[:,1]
z=df_wine["class"]
plt.figure(figsize=(10,10))
plt.subplot(4, 1, 1)
plt.scatter(x,y, c=z)
plt.show

# x-means
from pyclustering.cluster.xmeans import xmeans
from pyclustering.cluster.center_initializer import kmeans_plusplus_initializer
xm_c = kmeans_plusplus_initializer(X_norm, 2).initialize()
xm_i = xmeans(data=X_norm, initial_centers=xm_c, kmax=20, ccore=True)
xm_i.process()

# 結果をプロット
z_xm = np.ones(X_norm.shape[0])
for k in range(len(xm_i._xmeans__clusters)):
    z_xm[xm_i._xmeans__clusters[k]] = k+1

plt.subplot(4, 1, 2)
plt.scatter(x,y, c=z_xm)
centers = np.array(xm_i._xmeans__centers)
plt.scatter(centers[:,0],centers[:,1],s=250, marker='*',c='red')
plt.show
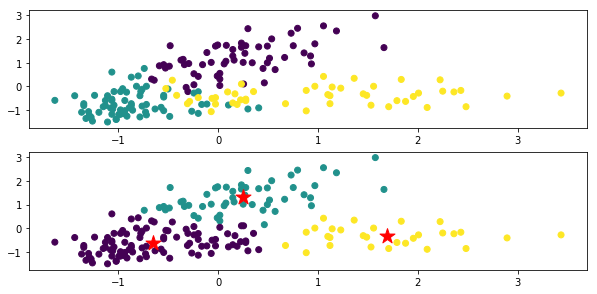
上が元々のデータのクラスごとに色付けした図,下がx-meansによるクラスタリング結果.
★印は各クラスの重心です.
コード内のxm_c = kmeans_plusplus_initializer(X_norm, 2).initialize()で,クラスター数の初期値を2に設定していますが,きちんと3つにクラスタリングしてくれています.
xm_i.process()でx-meansを実行しています.
x-meansインスタンス(上のコードではxm_i)について,学習前と学習後でインスタンス変数を色々見ると,学習結果がどんな感じかがわかると思います.例えば
xm_i.__dict__.keys()
または
vars(xm_i).keys()
で取得できる
dict_keys(['_xmeans__pointer_data', '_xmeans__clusters', '_xmeans__centers', '_xmeans__kmax', '_xmeans__tolerance', '_xmeans__criterion', '_xmeans__ccore'])
などを色々見るとよいかと思います.
_xmeans__pointer_data
クラスタリング対象となったデータのコピー.
_xmeans__clusters
各クラスターには,元データ(_xmeans__pointer_data)の何行目が属しているかを表したリスト.
リストの要素数はクラスター数と同じであり,各要素はまたリストになっており,クラスターに属する行の番号が格納されている.
_xmeans__centers
各クラスターのセントロイドの座標(リスト)からなるリスト
_xmeans__kmax
クラスター数の最大値(設定値)
_xmeans__tolerance
x-meansのiterationの停止条件を定める定数です.クラスターの重心の変化の最大値がこの定数を下回ったとき,アルゴリズムが終了します.
_xmeans__criterion
クラスターの分割の判定条件です.デフォルト:BIC
_xmeans__ccore
pythonコードの代わりにC++コードを使うかどうかの設定値です.