前回、投稿した記事(機械学習を使った半導体物性予測)ではMaterial ProjectのデータはPBEという汎関数が使用されているため、バンドギャップの計算精度が良くないため、予測ができないというご指摘があったため、今回はCitrinationという論文のバンドギャップの実験データをテキストマイニングによって収集したデータベースを使用します。
目的
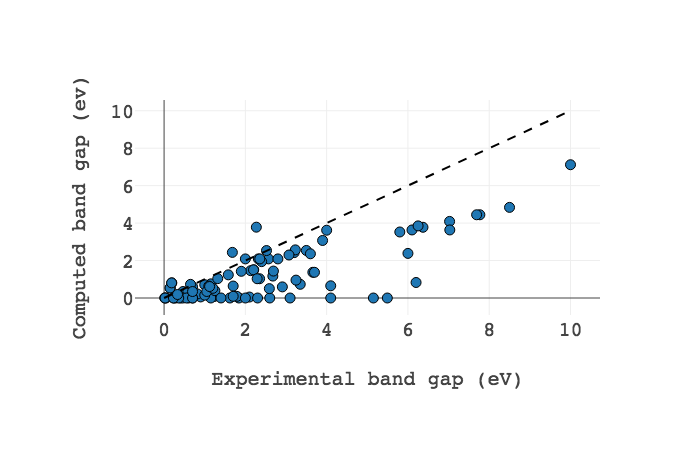
Material Projectによる第一原理計算のバンドギャップデータとCitrinationによる実験値を比較する。
動作環境
- Python 3.6.5:: Anaconda
- pandas 0.23.1
- pymatgen 2018.6.11
- matminer 0.3.7
$ pip install matminer
$ pip install pymatgen
Citrination (実験値)
import numpy as np
import pandas as pd

# pandasの設定
pd.set_option('display.width', 1000)
pd.set_option('display.max_columns', None)
pd.set_option('display.max_rows', None)

import warnings
warnings.filterwarnings('ignore')

from matminer.data_retrieval.retrieve_Citrine import CitrineDataRetrieval

api_key = xxxxxxxxxxxxx # CitrinationのAPI key
c = CitrineDataRetrieval(api_key)

df = c.get_dataframe(criteria={'data_type': 'EXPERIMENTAL', 'max_results': 100},
                     properties=['Band gap', 'Temperature'],
                    common_fields=['chemicalFormula'])
df.rename(columns={'Band gap': 'Experimental band gap'}, inplace=True)
Material Project (計算値)
from pymatgen import MPRester, Composition
api_key = yyyyyyyyyyy # Material ProjectのAPI key
mpr = MPRester(api_key)

def get_MP_bandgap(formula):
    """Given a composition, get the band gap energy of the ground-state structure
    at that composition

    Args:
        composition (string) - Chemical formula
    Returns:
        (float) Band gap energy of the ground state structure"""
    reduced_formula = Composition(formula).get_integer_formula_and_factor()[0]
    struct_lst = mpr.get_data(reduced_formula)

    if struct_lst:
        return sorted(struct_lst, key=lambda e: e['energy_per_atom'])[0]['band_gap']

df['Computed band gap'] = df['chemicalFormula'].apply(get_MP_bandgap)
結果
from matminer.figrecipes.plot import PlotlyFig

pf = PlotlyFig(df, x_title='Experimental band gap (eV)',
               y_title='Computed band gap (ev)',mode='notebook',
               fontsize=20, ticksize=15)
pf.xy([('Experimental band gap', 'Computed band gap'), ([0, 10], [0, 10])],
      modes=['markers', 'lines'], lines=[{}, {'color': 'black', 'dash': 'dash'}],
      labels='chemicalFormula', showlegends=False)