TensorFlowの使い方の勉強を兼ねて、sin関数近似をするプログラムを解説します。
学習モデル
パラメータの定義
X(入力値)とt(教師データ)について。Placeholderにトレーニングセットのデータを保存する
例えば、[None,5]は[任意×5]の行列を表しています。
tは、データ数を任意に取れるように[None,1]としておきます。
w(重み)について。最適化の対象となるVariableに相当するものなので、tf.Variableクラスのインスタンスとして定義します。
初期値0の5×1行列にします。
これらにより入力層1、中間層5、出力層1のネットワークを作ります。
x=tf.placeholder(tf.float32,[None,5])
w=tf.Variable(tf.zeros([5,1]))
t=tf.placeholder(tf.float32,[None,1])
計算式
y=Xwの式は以下のように表現されます。
y=tf.matmul(x,w)
tf.matmulは行列の掛け算を行う関数で、先に定義したplaceholder xとVariable wを用いています。まだ具体的な値は入っておらず、yも具体的には決まっていません。
誤差関数
教師データtと出力yの差を二乗和を表しています。この二乗誤差を最小化していくように学習していきます。この際の最適化のアルゴリズムも選択します。
loss=tf.reduce_sum(tf.square(y-t))
train_step=tf.train.AdamOptimizer().minimize(loss)
トレーニングの実行
セッションの用意
トレーニングアルゴリズムの実行環境となる「セッション」を用いてVariableに相当する変数を計算していきます。
まずは新しいセッションを用意して、Variableを初期化します。
sess=tf.Session()
sess.run(tf.initialize_all_variables())
トレーニングデータセットの代入
Placeholderにトレーニングセットのデータを代入していきます。
train_tは実際のデータです。
train_t=np.array([np.sin(2.0*np.pi*i/11) for i in range(12)])
train_t=train_t.reshape([12,1])

train_x=np.zeros([12,5])
for row,m in enumerate(range(1,13)):
    for col,n in enumerate(range(0,5)):
        train_x[row][col]=m**n
最適化の実施
定義したトレーニングアルゴリズムtrain_stepを実行して、重みを修正していきます。
この時、feed_dictでPlaceholderに具体的な値をセットしています。
また、loss_valのように、セッション内でlossを評価し、その時点の値を取り出すこともできます。
そして、トレーニングを打ち切った後(forループを抜けだした後)の時点でのパラメータの値を出力します。
i=0
for _ in range(100000):
    i+=1
    sess.run(train_step,feed_dict={x:train_x,t:train_t})
    if i % 1000==0:
        loss_val=sess.run(loss,feed_dict={x:train_x,t:train_t})
        print ('Step:%d, Loss:%f'%(i,loss_val))

w_val=sess.run(w)
print w_val
テスト
以下のような式でテスト結果の曲線を出力します。
y(x)=w0+w1x+w2x^2+w3x^3+w4x^4
def predict(x):
    result=0.0
    for n in range(0,5):
        result+=w_val[n][0]* x**n
    return result
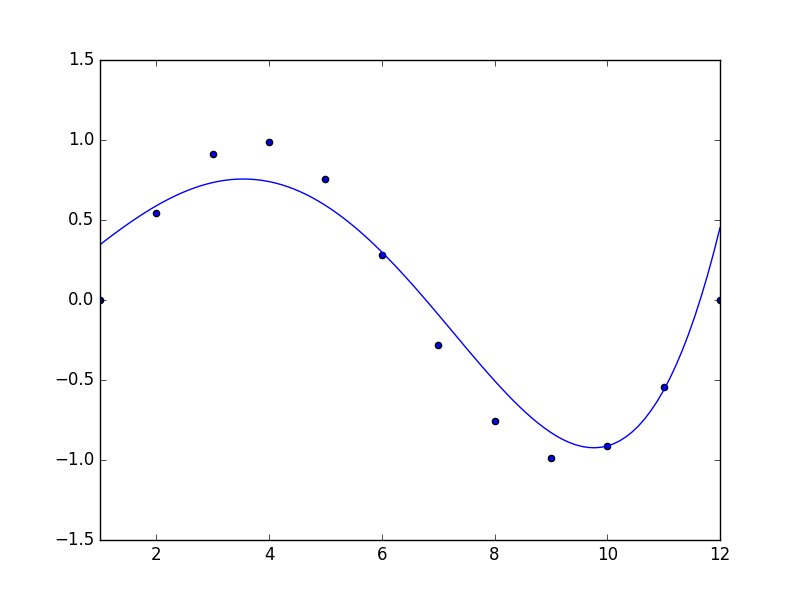
結果
中間層5層、学習回数10000回の時
プロットからずれてはいますがだいたい近似できているかと思います。

試しに中間層の数を変えてみると・・
中間層6層:よりずれてしまいました。
中間層4層:5層よりも近似できています。

適切な中間層の数(ハイパーパラメータ)を指定するのも大事ですね。。
コード全文
# -*- coding:utf-8 -*-
import tensorflow as tf
import numpy as np
import matplotlib.pyplot as plt

x=tf.placeholder(tf.float32,[None,5])
w=tf.Variable(tf.zeros([5,1]))

y=tf.matmul(x,w)

t=tf.placeholder(tf.float32,[None,1])
loss=tf.reduce_sum(tf.square(y-t))
train_step=tf.train.AdamOptimizer().minimize(loss)

sess=tf.Session()
sess.run(tf.initialize_all_variables())

train_t=np.array([np.sin(2.0*np.pi*i/11) for i in range(12)])
train_t=train_t.reshape([12,1])

train_x=np.zeros([12,5])
for row,m in enumerate(range(1,13)):
    for col,n in enumerate(range(0,5)):
        train_x[row][col]=m**n

i=0
for _ in range(100000):
    i+=1
    sess.run(train_step,feed_dict={x:train_x,t:train_t})
    if i % 1000==0:
        loss_val=sess.run(loss,feed_dict={x:train_x,t:train_t})
        print ('Step:%d, Loss:%f'%(i,loss_val))

w_val=sess.run(w)
print w_val

def predict(x):
    result=0.0
    for n in range(0,5):
        result+=w_val[n][0]* x**n
    return result

fig=plt.figure()
subplot=fig.add_subplot(1,1,1)
subplot.set_xlim(1,12)
subplot.scatter(range(1,13),train_t)
linex=np.linspace(1,12,100)
liney=predict(linex)
subplot.plot(linex,liney)
plt.show()