numpyのallについて
@shiracamus さんのコメントを参考にしてこちらに新しく記事を作成したのでこちらを参照にしてください.
はじめに
numpyのallとはnumpyの配列の要素が全てTrueであればTrueを, そうでなければFalseを返す関数です. ドキュメントはこちら.
numpyを用いた計算は非常に高速なので基本的にはnumpyで計算する方がpythonで直接記述するよりも高速なのですが, その部分をどうしても高速化したくなり色々試してみたところ, 限定的な条件であればそれを覆すことができてしまったので紹介したいと思います.
手法
手法としてはfor文で全ての配列要素にアクセスしてandで順に計算していくというものです. これをnumpyのallと比較します.
またnumbaを使用した時の時間も調べたいと思います.
ソースコード
import numpy as np
import time
import matplotlib.pyplot as plt
import sys

# allを使用
def func1(arr):
    return arr.all()

# and を for で使用
def func2(arr):
    tf = True
    for i in range(arr.size):
        tf = tf and arr[i]
    else:
        return tf

if __name__ == '__main__':
    if len(sys.argv) == 3:
        testsize, arr_size = map(int, sys.argv[1:])
    else:
        testsize = 10
        arr_size = 10
    # テストをする回数, 配列のサイズ
    print(testsize, arr_size)

    elapsed_time = []
    for i in range(testsize):
        # True と False の配列
        arr = np.random.randint(2, size=arr_size).astype(np.bool)
        start = time.time()

        func1(arr)

        end = time.time()
        elapsed_time.append((end - start) * 1e6)

    plt.plot(elapsed_time[1:], 'b', label='numpy all')

    elapsed_time = []
    for i in range(testsize):
        arr = np.random.randint(2, size=arr_size).astype(np.bool)
        start = time.time()

        func2(arr)

        end = time.time()
        elapsed_time.append((end - start) * 1e6)

    plt.plot(elapsed_time[1:], 'r', label='for')
    plt.xlabel('test size')
    plt.ylabel('elapsed time[us]')
    plt.legend()
    plt.show()
結果
numba不使用
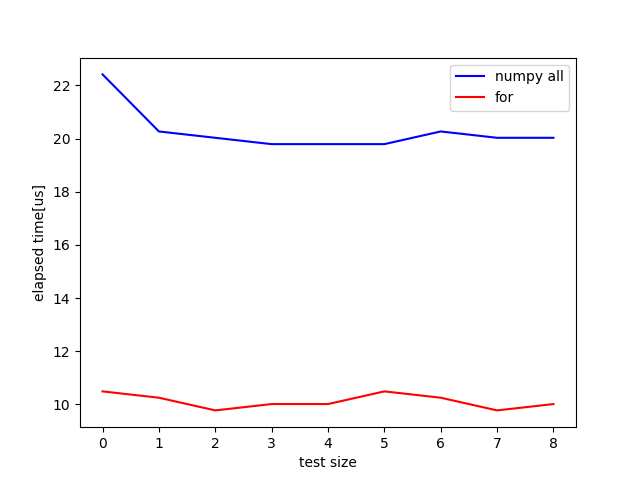
配列のサイズを10, テストする回数を10回とすると次の図のようになりました. for文を使用してandをしていった方が速くなっています.
配列のサイズを200, テストする回数を10回とすると次の図のようになりました. allの方が高速になってますね.
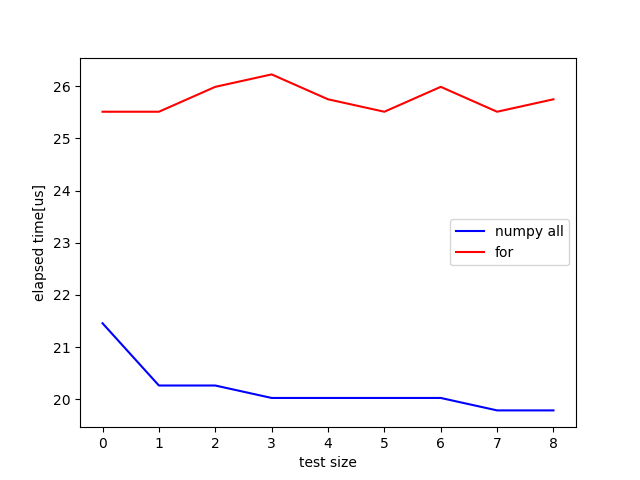
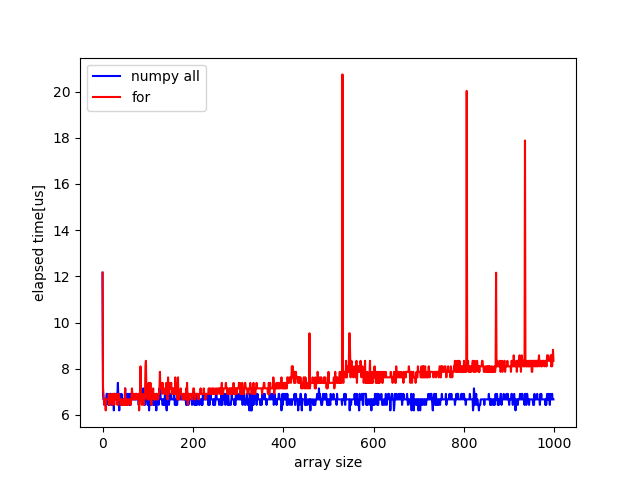
配列のサイズを大きくするにつれてfor文の方が遅くなってきます.
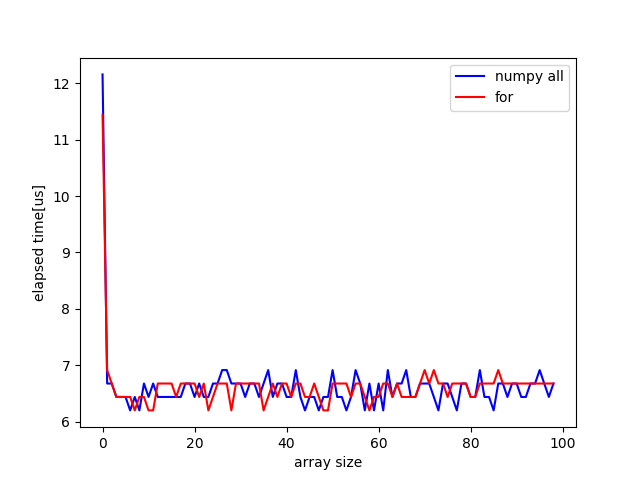
その様子は次の図でわかります. このパルス状に見えるものが何かは不明です. ここから環境にも依ることとは思いますが配列のサイズが100以下であればpythonでそのまま記述した方が高速になることがわかりました.
numba使用
numbaはJust In Time(JIT)コンパイルを行うので一番最初に関数にアクセスするのに時間がかかります. そのため一番最初のアクセスにかかる経過時間を除いてplotしています.すると図のような結果が得られました. 二回目のアクセスにもどうやら時間がかかるみたいです. 実行時間としては差がなくなったと言えるでしょう.
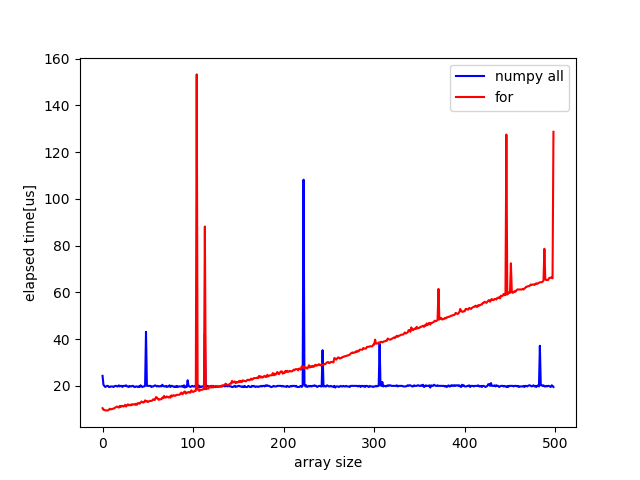
配列がより大きい場合は次の図のようになります. numpyの方が高速になっています.
結論
グラフをたくさん貼りましたが言いたいことは以下の2つです.
- 配列のサイズが小さい時はnumbaを使用しないという条件であればfor文を用いた方が高速
- numbaは高速化に貢献する
最後に
あのグラフに現れるパルスは何だったのだろうか.