KaggleのKernelを見ていてHighchartersを知り、R for Data Scienceを勉強していてgapminderを知ったので、両者を組み合わせ可視化してみると面白いのではないかと思い試してみたのでその結果をブログに書きます。
準備
以下のpackageを読み込んでおきます。
installしていなかったら適宜install.packages()でinstallしておきます。
library(tidyverse)   # data manipulation and visualization
library(gapminder)  # data
library(countrycode)  # visualization
library(highcharter)  # visualization
gapminder
まずはgapminderにどのようなデータが格納されているか確認します。詳細に関しては"?gapminder"で確認することもできます。
gapminder
# A tibble: 1,704 x 6
  country     continent  year lifeExp      pop gdpPercap
  <fct>       <fct>     <int>   <dbl>    <int>     <dbl>
1 Afghanistan Asia       1952    28.8  8425333      779.
2 Afghanistan Asia       1957    30.3  9240934      821.
3 Afghanistan Asia       1962    32.0 10267083      853.
4 Afghanistan Asia       1967    34.0 11537966      836.
5 Afghanistan Asia       1972    36.1 13079460      740.
6 Afghanistan Asia       1977    38.4 14880372      786.
7 Afghanistan Asia       1982    39.9 12881816      978.
8 Afghanistan Asia       1987    40.8 13867957      852.
9 Afghanistan Asia       1992    41.7 16317921      649.
10 Afghanistan Asia       1997    41.8 22227415      635.
# ... with 1,694 more rows
各国毎の平均余命、人口、一人当たりのGDPを経年で比較することができます。
前処理
可視化する際に扱いやすいようにcountryの名称をiso3に変換します。
foo <- gapminder %>%
  filter(year == 2007) %>%
  mutate(iso3 = countrycode(country, origin = "country.name", destination = "iso3c"))
Highchartersで可視化する
以下コードで可視化することができます。
highchart() %>%
  hc_add_series_map(worldgeojson, foo, value = 'lifeExp', joinBy = 'iso3') %>%
  hc_title(text = 'Life expectancy in 2007') %>%
  hc_colorAxis(minColor = "#ffdf3f", maxColor = "#5c46ff", min = min(foo$lifeExp), max = max(foo$lifeExp)) %>%
  hc_tooltip(useHTML = TRUE, headerFormat = "", pointFormat = "{point.country}: {point.lifeExp} years")
できました!
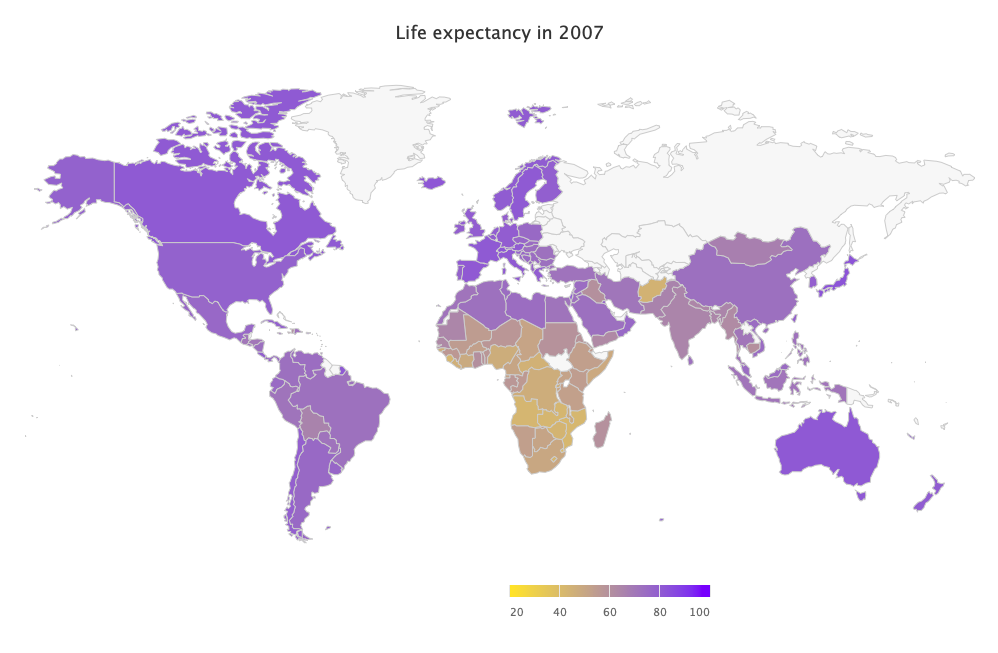
ちなみにR上ではマウスオーバーで国の名前とその平均寿命を確認することもできます。
コミュニケーションする際にこういったグラフがあると便利そうですね。
enjoy!