折れ線グラフとは
折れ線グラフは散布図の一種で、プロットされた点を直線でつないだものです。
通常は時間の経過を軸とします。
簡単な折れ線グラフ
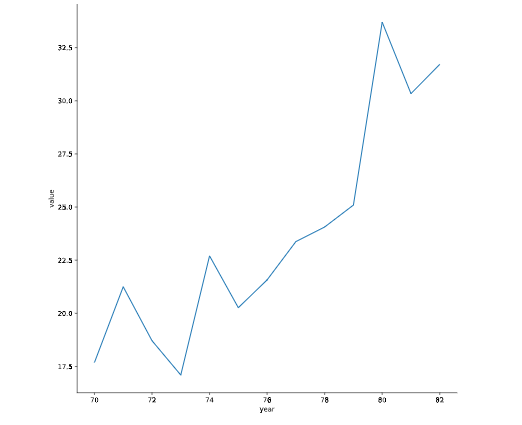
折れ線グラフはrelplot(relational plot)で描きます。
import matplotlib.pyplot as plt
import seaborn as sns

sns.relplot(x='year', y='value', data=test_data, kind='line')

plt.show()
X値に対して複数Y値が存在ある場合
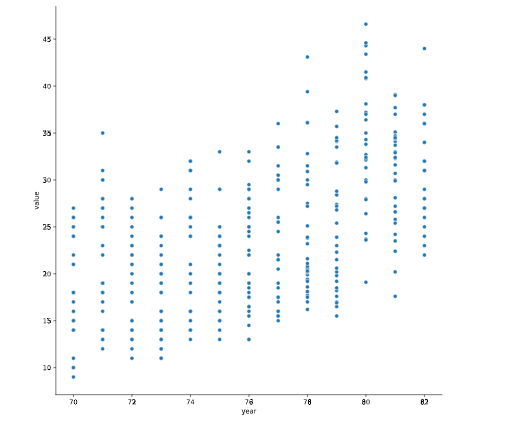
X値に対して複数Y値が存在ある場合、散布図は以下になります。
sns.relplot(x='year', y='value', data=test_data, kind='scatter')
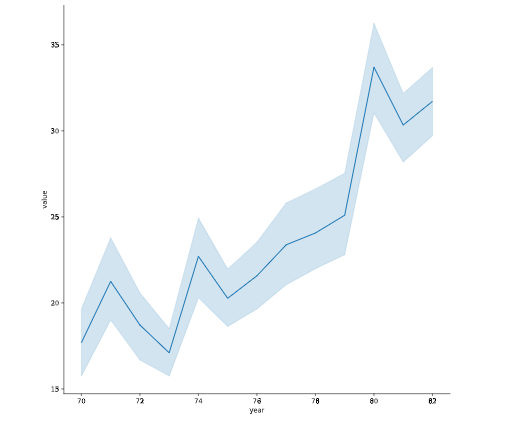
これを折れ線グラフに表現すると以下になります。
sns.relplot(x='year', y='value', data=test_data, kind='line')
実線は平均値を示し、範囲はデフォルトで信頼区間(confidence interval)を示します。(95%の確率でこの範囲に真値が存在すること)
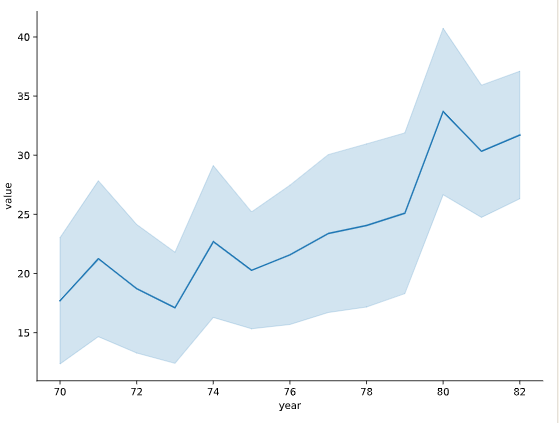
範囲で標準偏差(standard deviation)を示したい場合はciで'sd'を指定します。
sns.relplot(x='year', y='value', data=test_data, kind='line', ci='sd')
範囲を無くしたい場合は、ciでNoneを指定します。
常用オプション
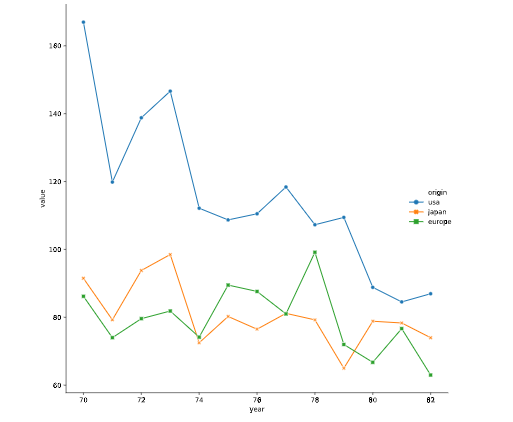
- hue: 色で新しい次元を表示
- style: 点と線のスタイルで新しい次元を表示
- markers: 点の表示/非表示
- dashes: 破線で表示True、直線で表示False
sns.relplot(x="year", y="value",
            data=test_data, kind="line",
            hue="origin", style="origin",
            markers=True, dashes=False)
