動機
Google ColabではデフォルトでPyStanが使えるようになっている[1]が、RStanも簡単に使えるかどうか気になった。
結論
プリインストールはされていない。自分でインストールすれば普通に使えるが、(当然のごとく)ビルドが遅い。
-> なんとかしたい
![]()
手順
やることはシンプル(あくまで応急処置的なハック...)
- 初回は普通にRStan(など)をインストールし、パッケージをまるごとGoogle Driveに保管
- 次回からはビルド済みのパッケージたちを読みにいく
以下、RランタイムでGoogle Driveのマウントは提供されていないため、ノートブックの設定はデフォルト(Python)のままにしておく。
準備
Google Driveのマウント
from google.colab import drive
drive.mount("/content/gdrive")
R magicの有効化
%load_ext rpy2.ipython
Googleドライブのフォルダ(別途手動で作成)をRライブラリのパスとして指定
%%R
# Rのライブラリを管理するフォルダのパスを追加
.libPaths("/content/gdrive/MyDrive/workspace/r_libs")
# 確認
.libPaths()
以下のように、パスが追加された
> [1] "/content/gdrive/MyDrive/workspace/r_libs"
> [2] "/usr/local/lib/R/site-library"
> [3] "/usr/lib/R/site-library"
> [4] "/usr/lib/R/library"
一回目は普通にRStanをインストール(上記で指定したフォルダにインストールされる)
%%R
# 初回のみ実行
install.packages("rstan")
コーディング
普通にコードを書く(可変なのは基本的にこの部分のみ)
Stanファイルはローカル環境で作成し、Google Driveにアップロードしておく(以下、ファイルパスは"/content/gdrive/MyDrive/workspace/schools.stan"とする)。
schools.stan
data {
  int<lower=0> J;          // number of schools
  real y[J];               // estimated treatment effects
  real<lower=0> sigma[J];  // s.e. of effect estimates
}
parameters {
  real mu;
  real<lower=0> tau;
  vector[J] eta;
}
transformed parameters {
  vector[J] theta;
  theta = mu + tau * eta;
}
model {
  target += normal_lpdf(eta | 0, 1);
  target += normal_lpdf(y | theta, sigma);
}
ipynbファイルの続き
%%R
library(rstan)

# 並列処理の指定
options(mc.cores = parallel::detectCores())

# === 以下、https://cran.r-project.org/web/packages/rstan/vignettes/rstan.html を参照 === #
# データの準備
schools_data <- list(
  J = 8,
  y = c(28,  8, -3,  7, -1,  1, 18, 12),
  sigma = c(15, 10, 16, 11,  9, 11, 10, 18)
)

# サンプリング
fit1 <- stan(
  file = "/content/gdrive/MyDrive/workspace/schools.stan",  # Stan program
  data = schools_data,    # named list of data
  chains = 4,             # number of Markov chains
  warmup = 1000,          # number of warmup iterations per chain
  iter = 2000,            # total number of iterations per chain
  cores = 1,              # number of cores (could use one per chain)
  refresh = 0             # no progress shown
  )

print(fit1, pars=c("theta", "mu", "tau", "lp__"), probs=c(.1,.5,.9))
出力
Inference for Stan model: schools.
4 chains, each with iter=2000; warmup=1000; thin=1;
post-warmup draws per chain=1000, total post-warmup draws=4000.

           mean se_mean   sd    10%    50%    90% n_eff Rhat
theta[1]  11.48    0.18 8.37   2.33  10.39  22.33  2112 1.00
theta[2]   7.94    0.09 6.31  -0.02   8.06  15.66  4554 1.00
theta[3]   6.34    0.15 7.76  -3.05   6.73  15.18  2741 1.00
theta[4]   7.71    0.11 6.41  -0.06   7.58  15.48  3198 1.00
theta[5]   5.15    0.10 6.17  -3.07   5.61  12.64  3653 1.00
theta[6]   6.24    0.11 6.68  -1.93   6.40  14.06  3474 1.00
theta[7]  10.77    0.13 6.91   2.72  10.04  19.73  2729 1.00
theta[8]   8.58    0.15 7.92  -0.54   8.32  17.91  2807 1.00
mu         8.08    0.19 5.19   1.80   7.95  14.35   751 1.00
tau        6.63    0.23 5.59   0.95   5.31  13.91   579 1.01
lp__     -39.46    0.08 2.59 -42.85 -39.29 -36.29  1127 1.00

Samples were drawn using NUTS(diag_e) at Sat May 14 22:49:21 2022.
For each parameter, n_eff is a crude measure of effective sample size,
and Rhat is the potential scale reduction factor on split chains (at
convergence, Rhat=1).
まとめ
Rの実行時に各セルの最初に"%%R"を付けるのはめんどうだが、毎回RStanのインストールで10分ほど待たされるより各段にマシだと思う。ただ、Google Colabratoryの手軽さを少しく毀損しているため、公式のサポート(RStanのプリインストールやRランタイムでのGoogle Driveマウントなど)を期待したい。
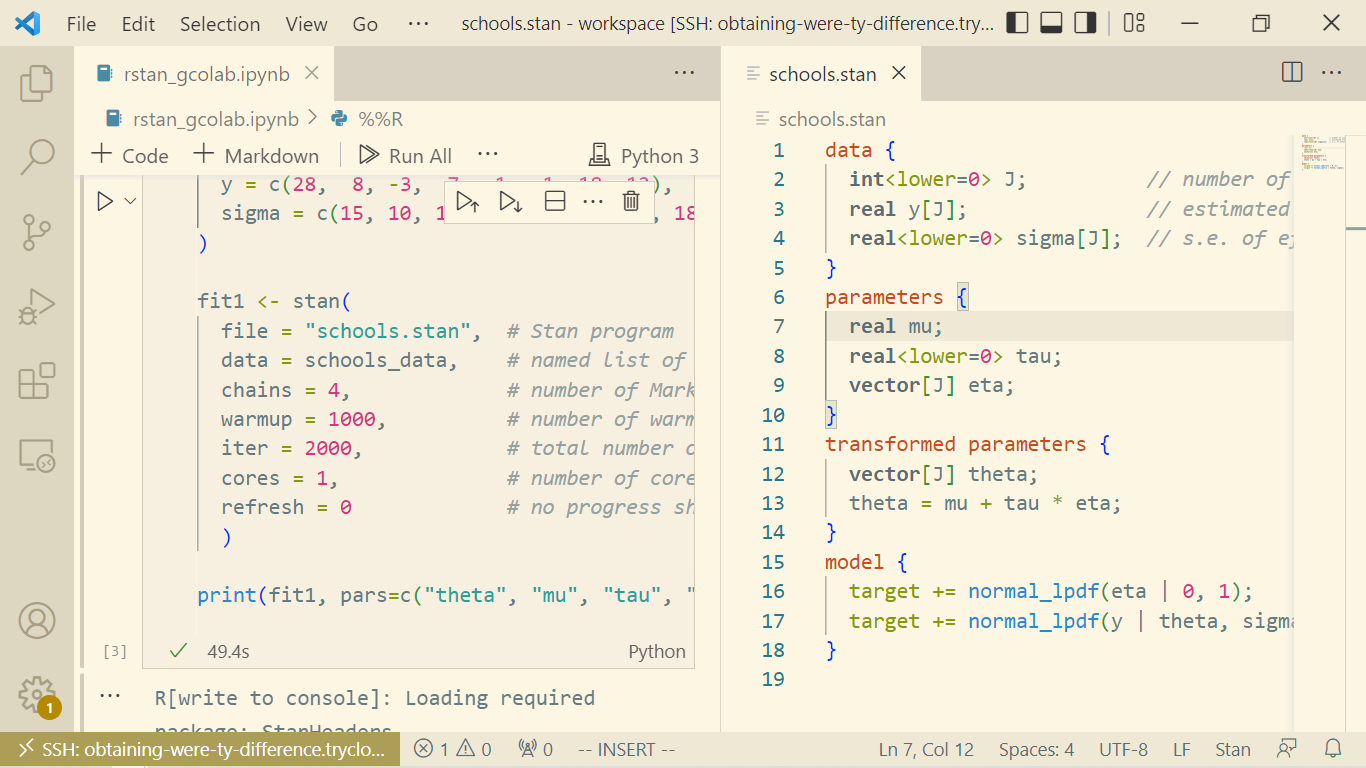
おまけ
こういうやつを使うと、ipynbファイルの執筆もstanファイルの執筆もVSCode上で完結させることが出来る。
おわり