はじめに
データの可視化について
- 平行座標プロット
- 散布図行列
が便利だよ、ということなので使ってみる。
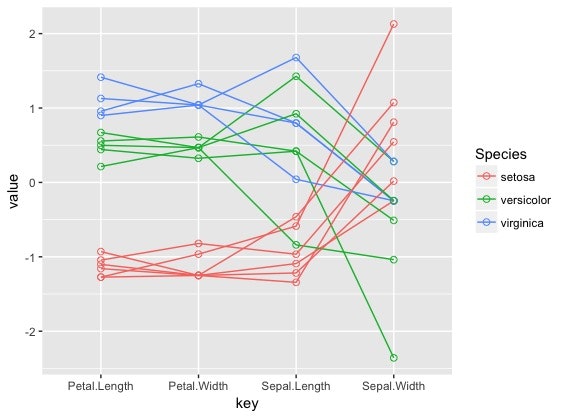
平衡座標プロット
キモはID列をつくって、groupで行ごとにプロットさせることらしい。
また、必要に応じて変数を正規化する。
parallel_plot.r
library("tidyverse")

ggplot(iris %>%
         sample_n(15) %>% #数が多いので一部のみ抽出
         mutate(ID = 1:n()) %>% #ID割り振り
         mutate_if(is.numeric,scale) %>%  #正規化
        gather(key,value,c(1,1:4)), #long styleに変換
        aes(key,value,group=ID,colour=Species))+
    geom_line() +
    geom_point(size=2,shape=1) #軸との交点を見やすくするオプション
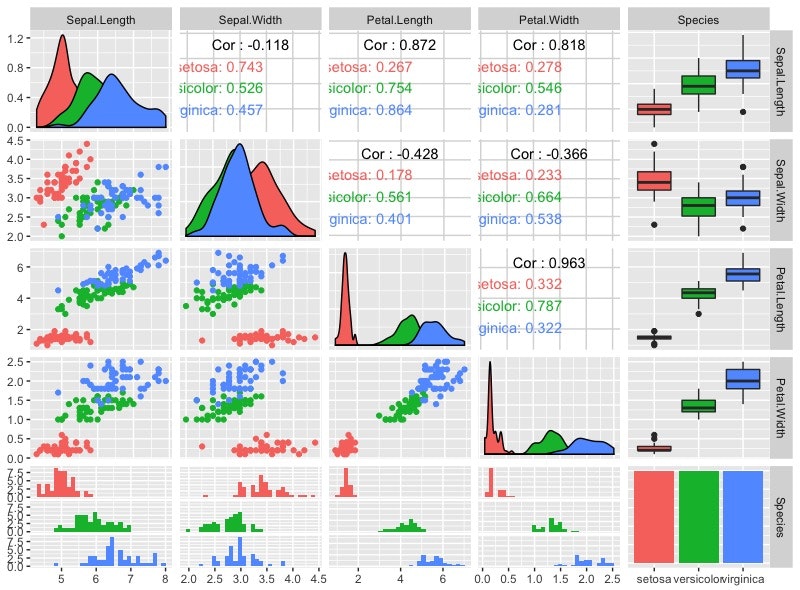
散布図行列
GGallayを使って一発
scatter_plot_matrix.r
library("ggplot2")
library("GGally")

ggpairs(iris,aes_string(colour="Species")
参考サイト
・[ 統計はデータと人間のインターフェース ~統計数理研究所 中野純司先生インタビュー〜]
(http://www.datascientist.or.jp/dssjournal/2016/10/24/interview_08/)
・[How to plot parallel coordinates with multiple categorical variables in R]
(https://stackoverflow.com/questions/44351127/how-to-plot-parallel-coordinates-with-multiple-categorical-variables-in-r)
・[【Rメモ】多変数の関係性を視覚化する関数(パッケージ)まとめ]
(https://qiita.com/h_kobayashi1125/items/46bc28a26f888d03cee3)