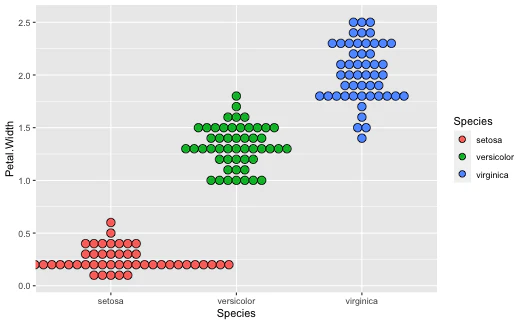
ドットプロット
dotplot.R
library(tidyverse)

ggplot(iris, aes(x=Species, y=Petal.Width, fill=Species)) +
      geom_dotplot(binaxis="y" , stackdir="center")
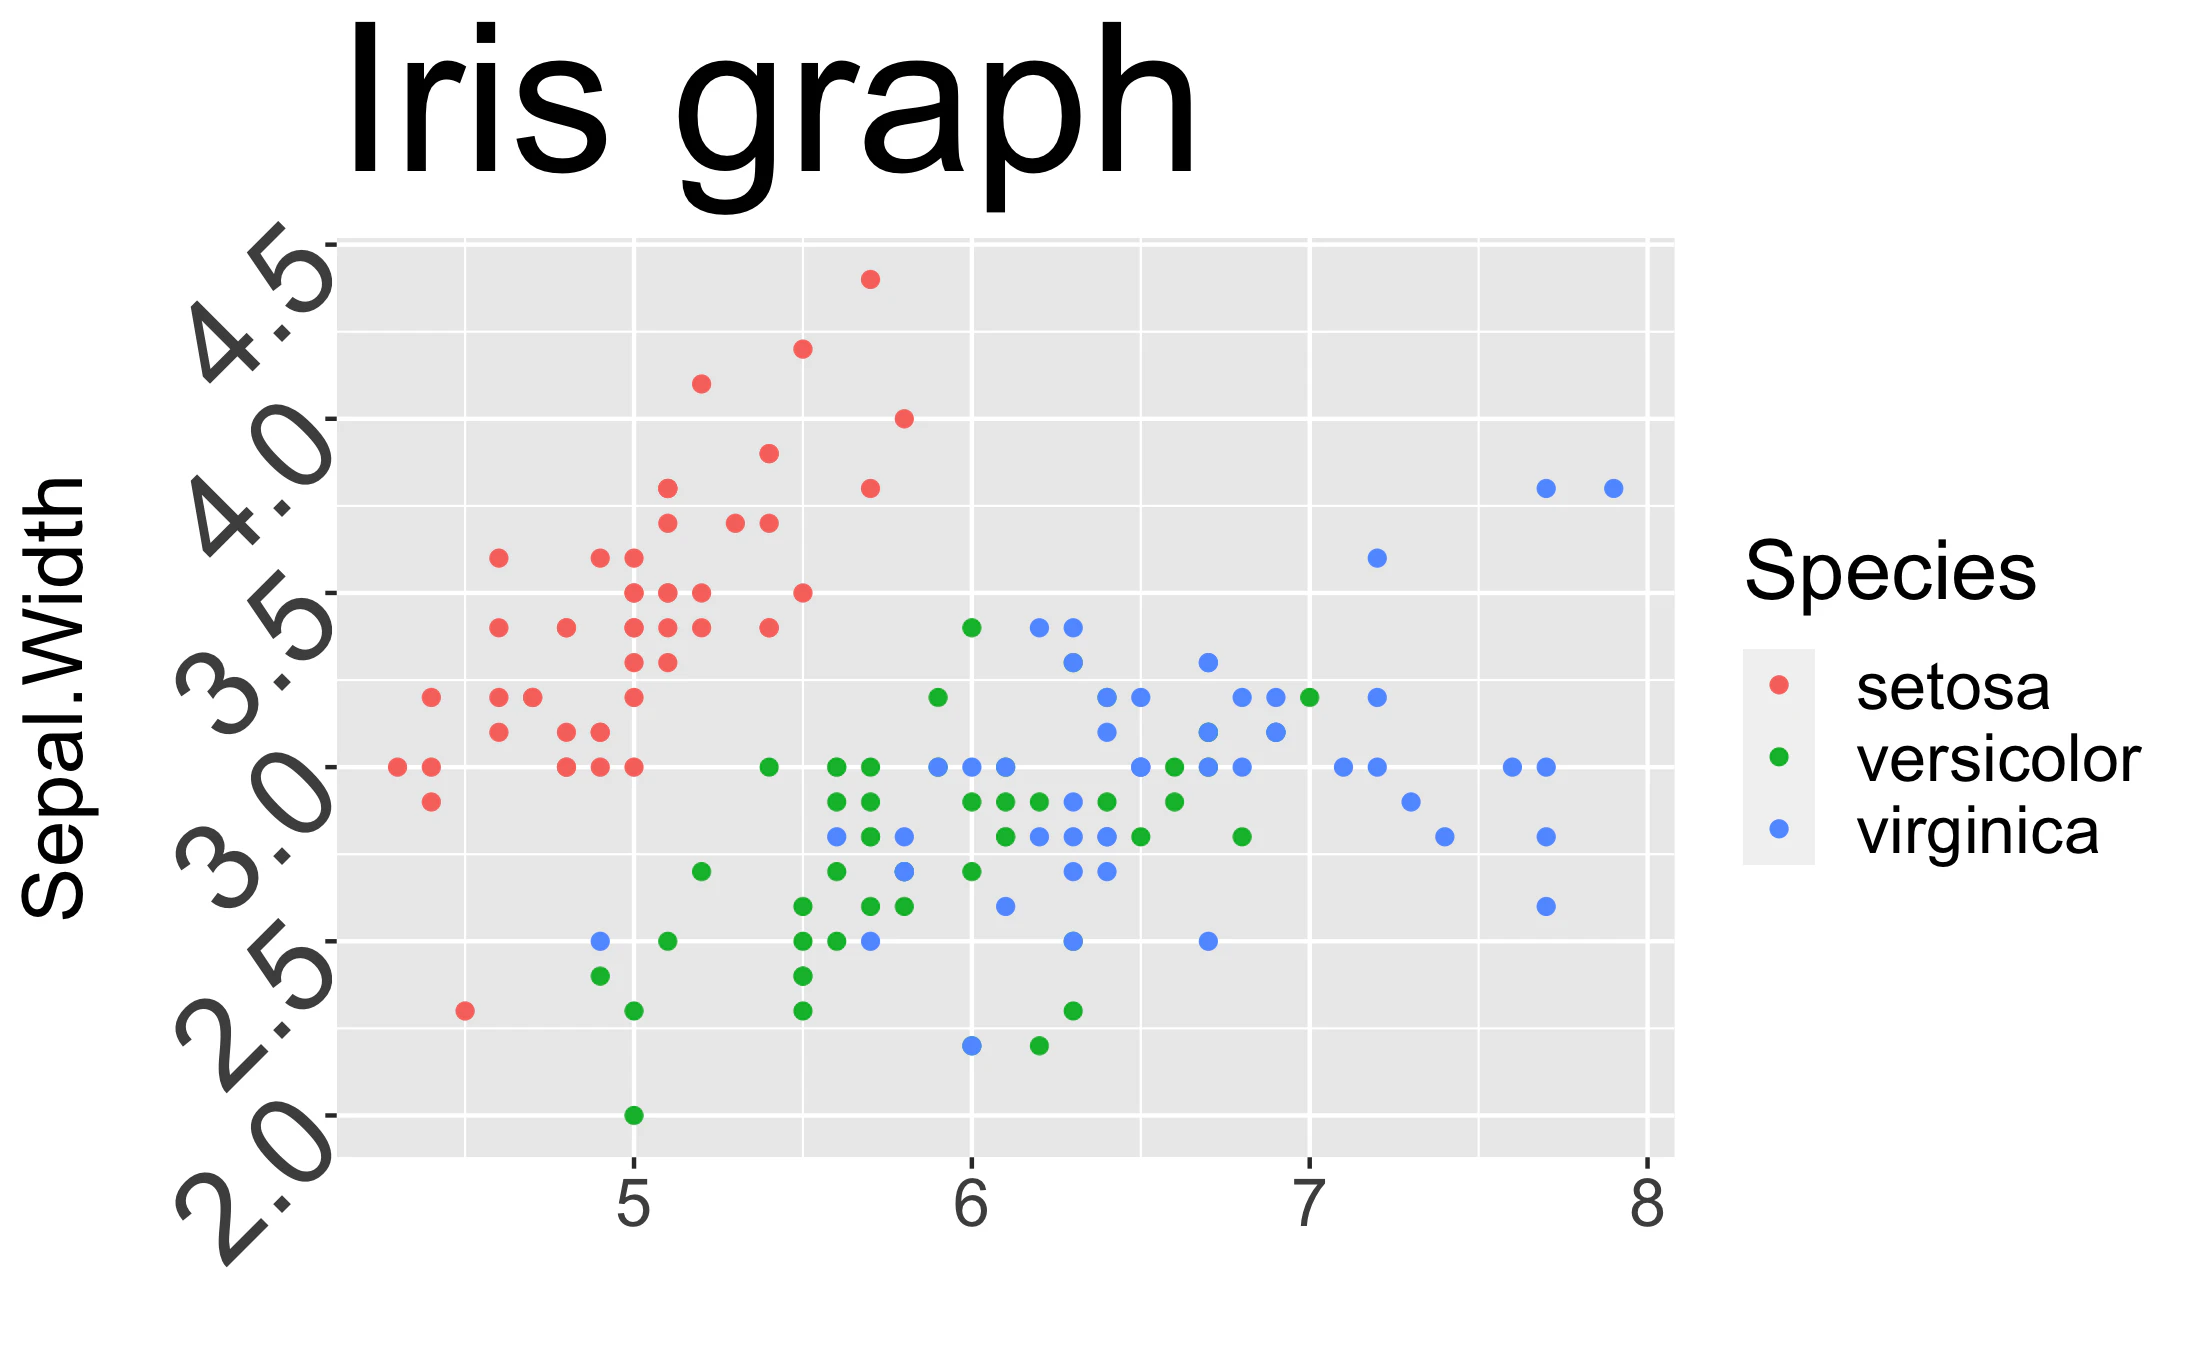
軸やタイトルの文字の大きさを変える
textsize.R
library(tidyverse)

ggplot(iris, aes(x=Sepal.Length, y=Sepal.Width,color=Species)) +
           geom_point() +
           ggtitle("Iris graph") +
           xlab("") +
           theme(text=element_text(size=20)) + #全体の文字サイズ
           theme(plot.title=element_text(size=50)) +  #タイトルの文字サイズ
           theme(axis.text.y = element_text(size=30)) + #軸の文字サイズ
           theme(axis.text.y = element_text(angle=45, vjust=0.5)) #軸の文字の回転
グラフに特殊文字を使う
special.R
library(tidyverse)

# ギリシャ文字や数式を含む列名を持つデータフレーム
special_character <- data.frame(wt = factor(c(1:5)), mpg = 10*rnorm(5),
                   gear = factor(c("alpha","beta",'integral(x)*dx',"x^2","over(a,b)")))

ggplot(special_character,aes(x=wt, y=mpg)) +
      geom_point() +
  #Facetで使うとき → label_parsed
      facet_wrap(~ gear,labeller=label_parsed) +
  #タイトルに使うとき → expression
      ggtitle(expression(paste(alpha,beta,gamma,"123"))) +
      theme(plot.title = element_text(hjust=0.5)) +
  #グラフ内にかくとき → そのまま
      annotate("text",x=3.5,y=10, label="alpha * ' function'",parse=TRUE) +
  # 軸ラベルにかくとき → expression
      xlab(expression(frac(1,sqrt(2*pi))*"  x label"))

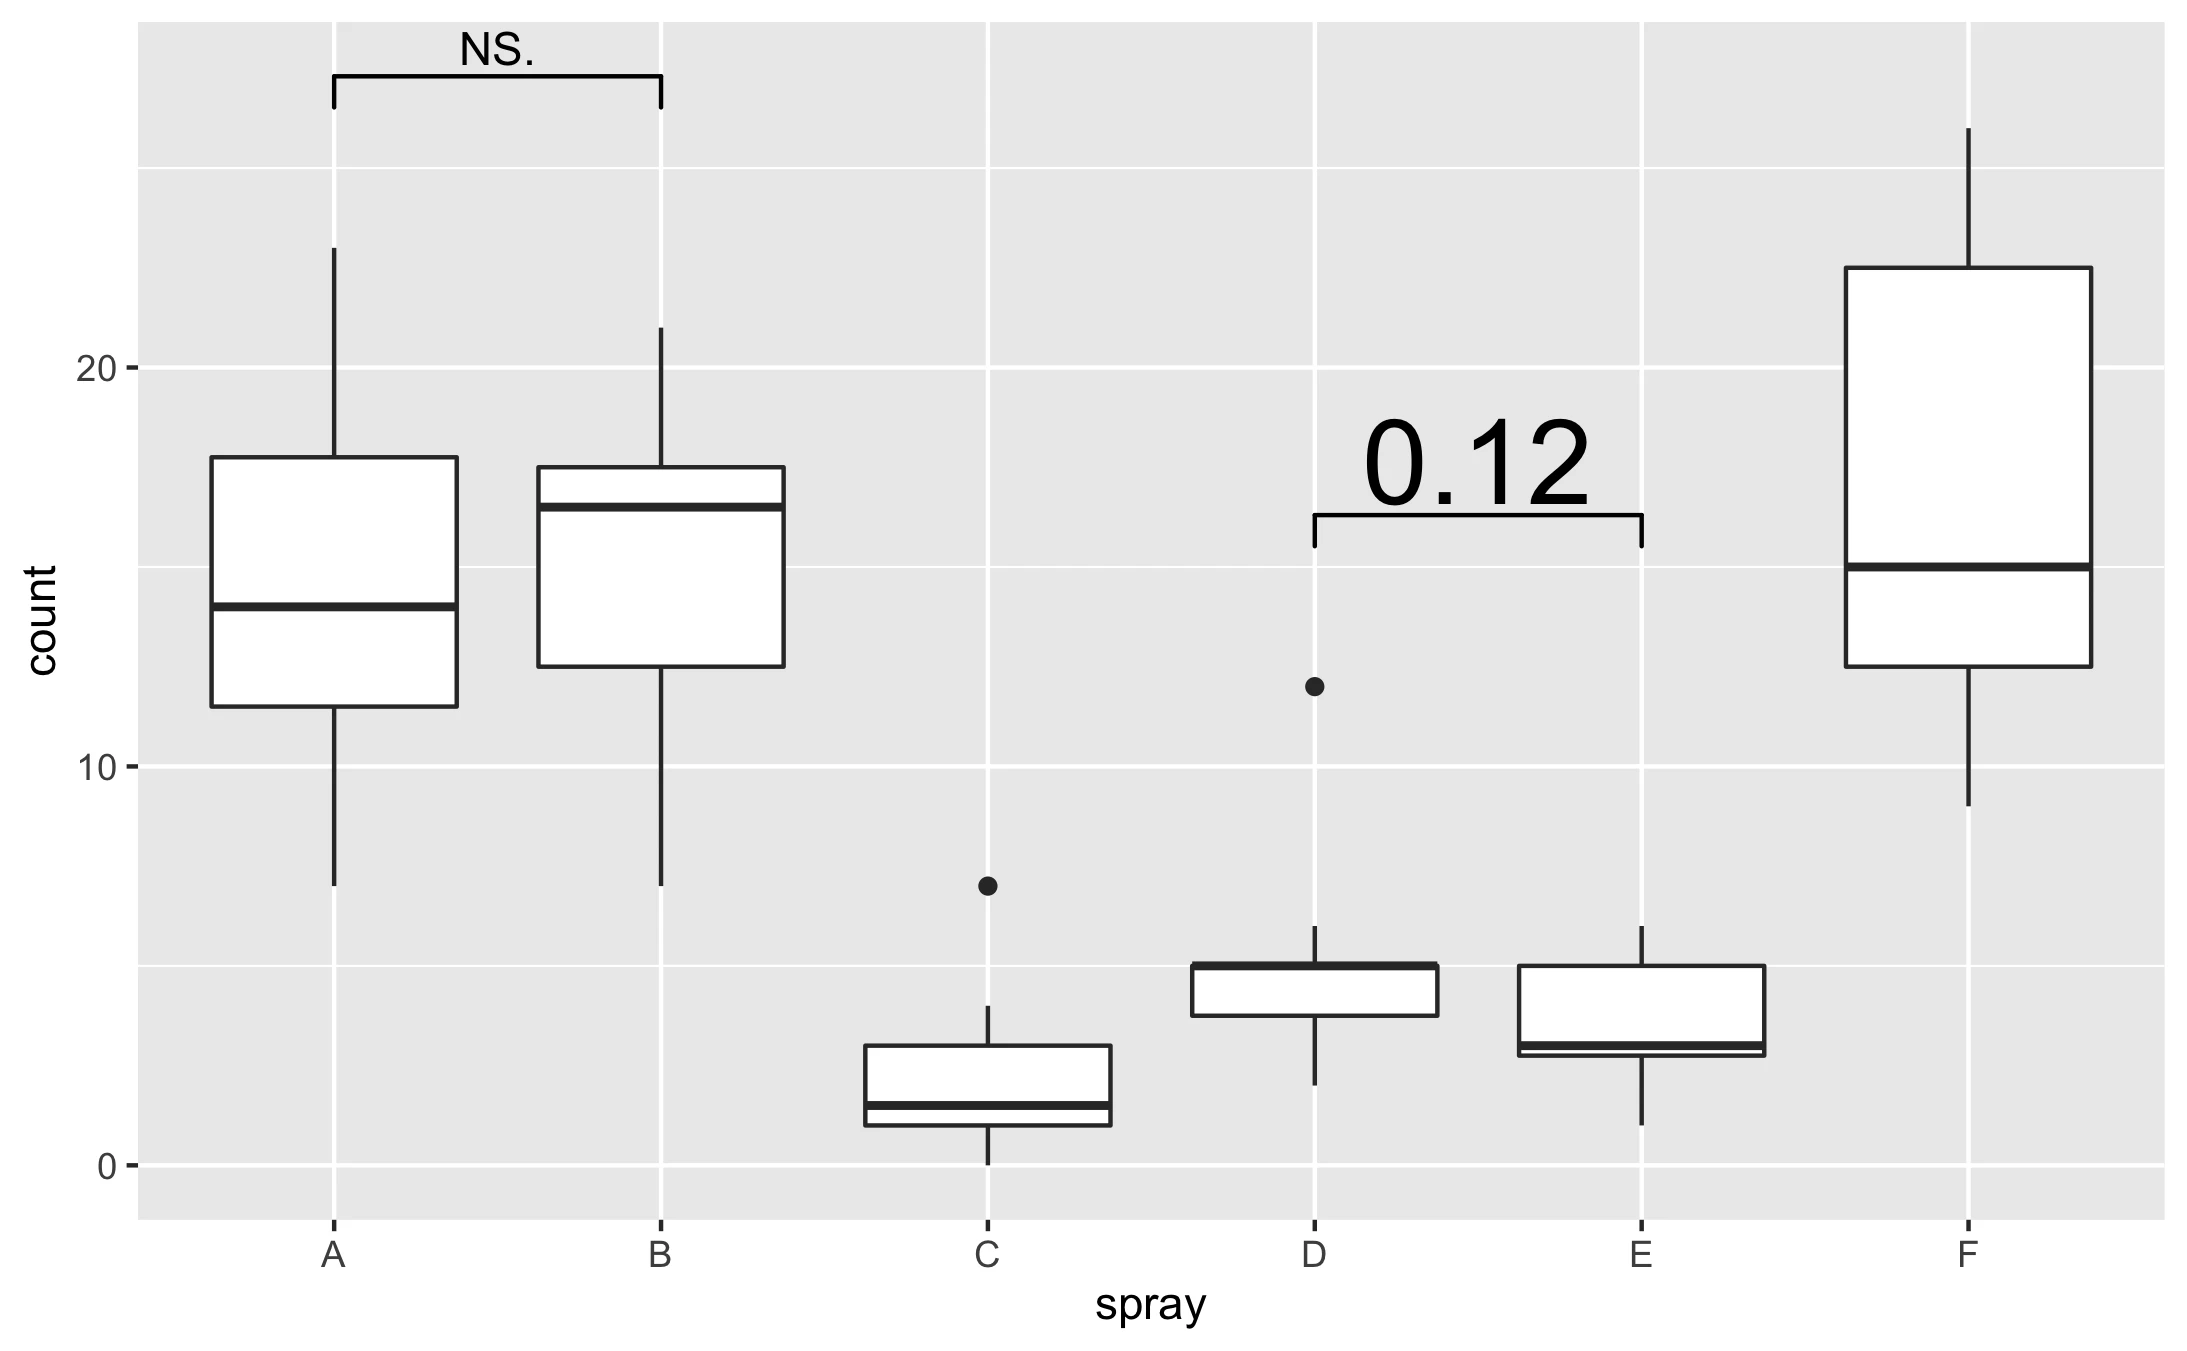
検定の結果を入れる
test.R
library(tidyverse)
library(ggsignif)

ggplot(InsectSprays, aes(x=spray, y=count)) +
      geom_boxplot() +
      geom_signif( test=t.test,
                   comparisons = list( c("A","B")),
                   map_signif_level = TRUE
      ) +
    geom_signif( test=t.test,
                 comparisons = list(c("D","E")),
                 map_signif_level = FALSE,
                 y_position = 15,
                 textsize = 10
                 )
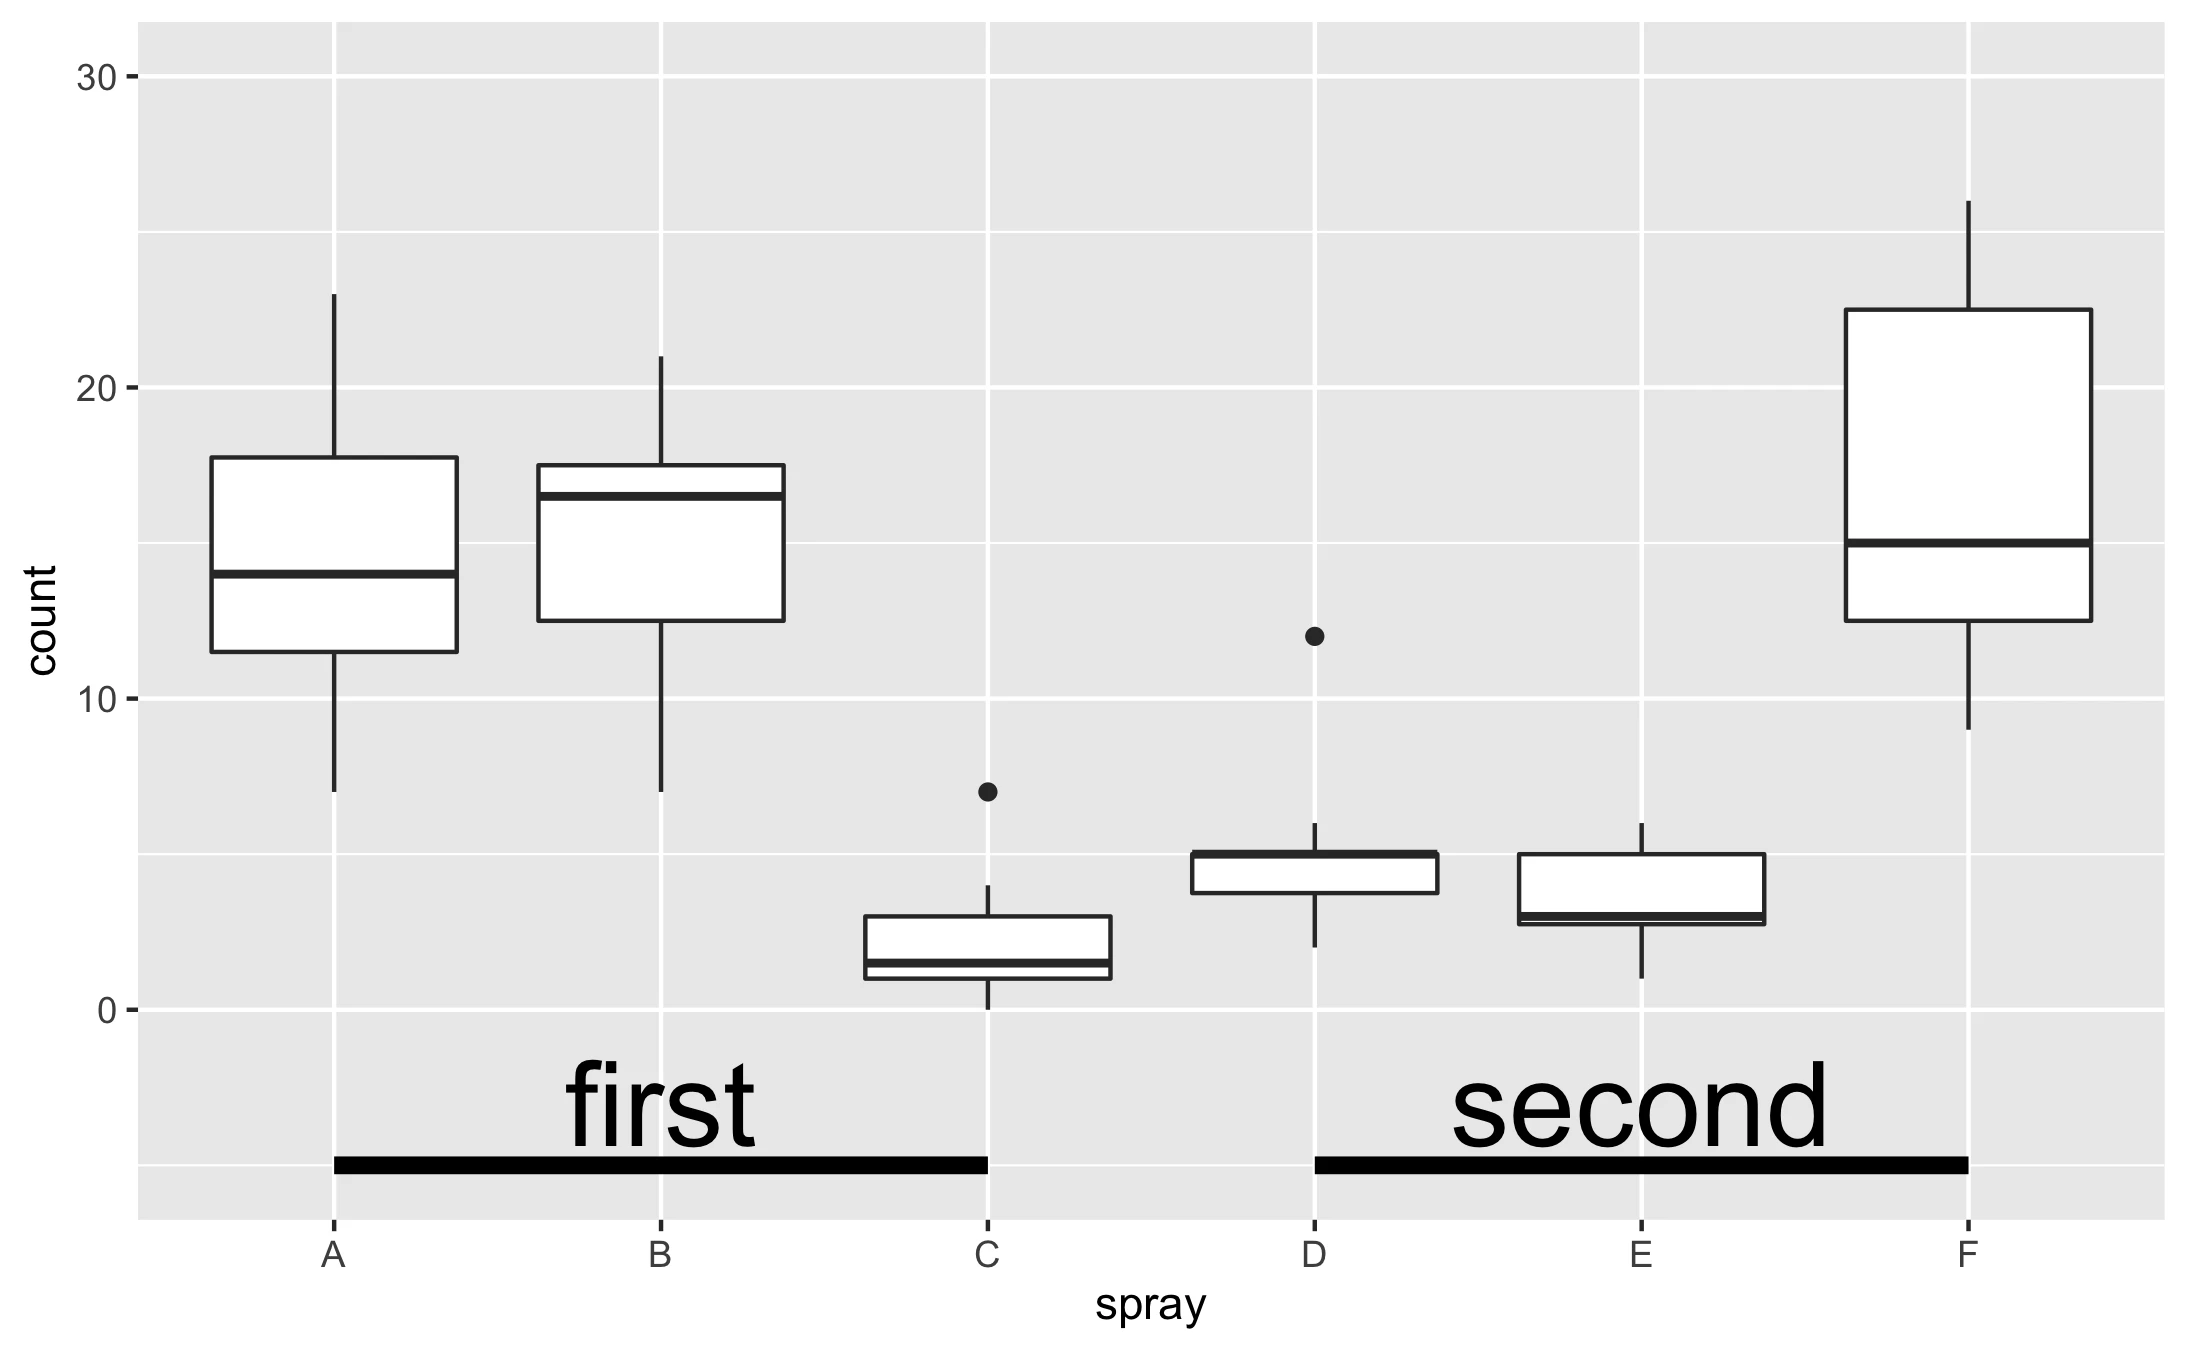
グループごとに下線を引く
group.R
library(tidyverse)

ggplot(InsectSprays, aes(x=spray,y=count)) +
        geom_boxplot()+

        ylim(-5,30) +
        annotate("segment",x=1,xend=3,y=-5,yend=-5,size=2) +
        annotate("text", x=2, y=-3, label="first",size=10) +
        annotate("segment",x=4,xend=6,y=-5,yend=-5,size=2) +
        annotate("text", x=5, y=-3, label="second",size=10)
その他
思い出したら追記していきます(多分)
参考文献
-
Rグラフィックスクックブック 第2版
Winston Chang 著、石井 弓美子、河内 崇、瀬戸山 雅人 訳 -
君の知らない物語(あまり知られていないtidyverseの便利な機能)
@uri(株式会社ホクソエム) - ggplot2で複数のプロットをまとめて表示する方法あれこれ