MPL(matplotlib)で 3D の散布図を作る際、scatter() に配色用の値listを渡すとき、陰面消去が狂ってしまう
先に結論: 散布データを list で渡すの諦めて、1個ずつ scatter() したら解決した。
2021/01/07 追記:
この記事の症例は MPL3.2.* の頃のバグだったようです。
MPLのVer.3.3.3 で試したところだいぶ挙動が変わってました。
どうやらlist渡しでも正常になった(?)模様。
また、一個ずつ渡す場合にdepthshade=Falseとしたときの処理が遅くなったかも。
散布図描画メソッド scatter() を使う際、
マーカーの位置と色分けの値は、普通はリストとかで渡したい。
ax.scatter(xs, ys, zs, c=vs, norm=norm, s=600, marker='o', alpha=1.0, zdir='z', depthshade=False )
ところが、なぜか c=vs で配色配列を渡した途端に陰面消去が狂ってしまい
「一番手前のマーカーが一番奥のマーカーに隠れて見えない」なんていうことが起きる。(バージョンに依存とかあるかも。)
対処:
思いつくことは一通り試しました結果、
「for 文でマーカー1個ずつ scatter()」 にしたら正常になりましたとさ。
ax = fig.add_subplot( 122, projection='3d')
for x,y,z,v in zip(xs,ys,zs,vs):
    ax.scatter(x, y, z, c=(v,),norm=norm, s=600, marker='o', alpha=1.0, zdir='z', depthshade=False )
以下は実例:
import numpy as np
import matplotlib.pyplot as plt
from matplotlib.colors import Normalize

def plot():
    def randrange(n, vmin, vmax):
        return (vmax - vmin)*np.random.rand(n) + vmin

    n = 20
    xs = randrange(n, 0, 100)
    ys = randrange(n, 0, 100)
    zs = randrange(n, 0, 100)
    vs = xs
    norm = Normalize(vmin=min(vs), vmax=max(vs) )

    fig = plt.figure()
    ax = fig.add_subplot(121, projection='3d')
    ax.scatter(xs, ys, zs, c=vs, norm=norm, s=600, marker='o', alpha=1.0, zdir='z', depthshade=False )
    ax.set_xlabel('X')
    ax.set_ylabel('Y')
    ax.set_zlabel('Z')

    ax = fig.add_subplot( 122, projection='3d')
    for x,y,z,v in zip(xs,ys,zs,vs):
        ax.scatter(x, y, z, c=(v,),norm=norm, s=600, marker='o', alpha=1.0, zdir='z', depthshade=False )

    ax.set_xlabel('X')
    ax.set_ylabel('Y')
    ax.set_zlabel('Z')

    plt.show()
Pyton3.8 実行結果↓
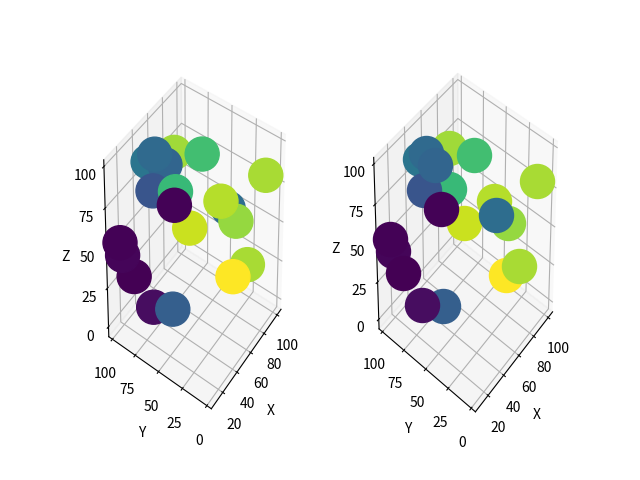
↑ 左図がlistで渡した場合、右図が1個ごとに渡した場合。(区別のつきやすい方向を選んで描画したつもり)
右図は正常です。
注意点:
1.scatter() をマーカー毎に呼ぶ場合は、カラーリングのレンジを統一するために
norm=Normalizeでレンジ固定し scatter() に norm=norm で渡す。
2.scatter() のオプション「depthshade=True」 がとても遅くします。デフォルトTrueのようなので、かならず「depthshade=False」すべし。
2020/01/07:MPLのVer3.3.3ではdepthshadeによる差は小さい(無くなった?)ようです。
※ scatter()とscatter3d()の挙動はたぶん同じ。
※matoplotlib の公式ドキュメントは確認していません。そもそも前提の使い方が間違っているかもしれません。あしからず。