PyODEのサンプル実行例
本家 PyODE 様サイト の「Tutorial 1」を実行してみました。
・「Tutorial 2」の実施記事はこちら
・「Tutorial 3」の実施記事はこちら
この「Tutorial 1」は1個のオブジェクトに初速を与えて様子を見るだけです。
「PyODEの動作確認」くらいの意味合いで、リザルト表示も標準出力への値表示だけです。
本記事では、Matplotlib でプロット表示を追加してみました。
コード(全部)
↓ 本家のコードにMatplotlib プロット呼び出しと、プロット用配列作成を足したものです
Tutorial-1_plot.py
# pyODE example 1: with MPL-plot

import ode

# Create a world object
world = ode.World()
world.setGravity( (0,-9.81,0) )

# Create a body inside the world
body = ode.Body(world)
M = ode.Mass()
M.setSphere(2500.0, 0.05)
M.mass = 1.0
body.setMass(M)

body.setPosition( (0,2,0) )
body.addForce( (0,200,0) )

# Do the simulation...
total_time = 0.0
dt = 0.04

import numpy as np
nt = 100
txyzuvw = np.zeros( (7,nt+1) )
tn=0
while total_time<2.0:
    x,y,z = body.getPosition()
    u,v,w = body.getLinearVel()
    print( "%1.2fsec: pos=(%6.3f, %6.3f, %6.3f)  vel=(%6.3f, %6.3f, %6.3f)" % \
          (total_time, x, y, z, u,v,w) )
    if tn <= nt:
        txyzuvw[0][tn]=total_time
        txyzuvw[1][tn]=x
        txyzuvw[2][tn]=y
        txyzuvw[3][tn]=z
        #txyzuvw[4][tn]=u
        #txyzuvw[5][tn]=v
        #txyzuvw[6][tn]=w

    world.step(dt)
    total_time+=dt

    tn += 1

end_tn = tn

import matplotlib.pyplot as plt
# MPL-Plot
plt.plot( txyzuvw[0][0:end_tn], txyzuvw[2][0:end_tn], label='Vertical position')
plt.xlabel('time [s]')
plt.ylabel('Vertical position [m]')
plt.savefig('./y.png')
↑ 20200506: スタートの位置記録できてなかったの修正
結果
(あらかじめnumpyとmatplotlibをインストールしてください。)
実行すると......
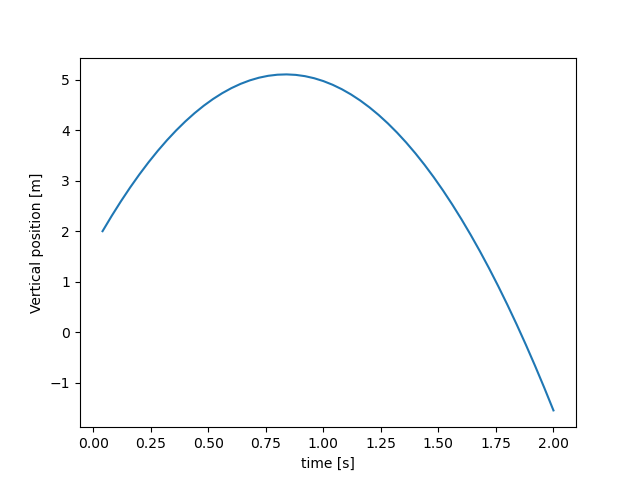
↑ このグラフ画像(PNG)がカレントに保存されます。
垂直方向(Y座標)に放りなげた物体の高さの時間変化です。