次のプログラムを組み合わせました。
MQTT Subscribe で受け取った温度と湿度をブラウザーに表示
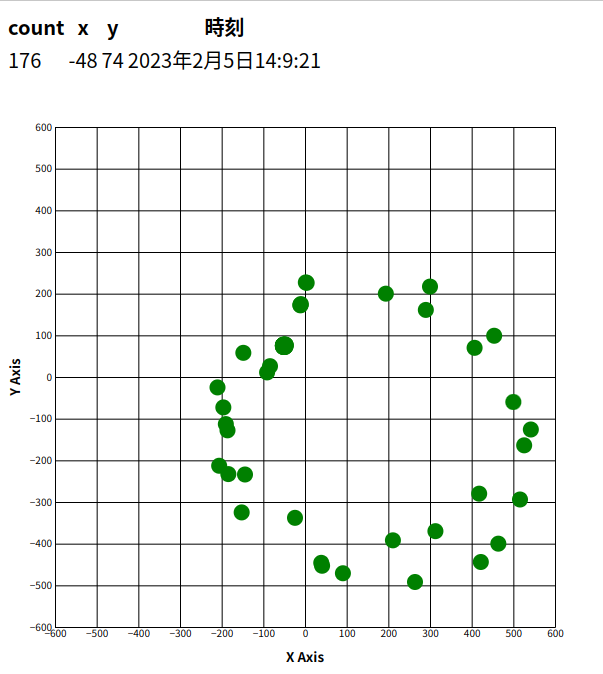
d3.v7.js で散布図を作成
描画した結果
プログラム
ブローカー example.com
トピック compass/test
ペイロード {"count": 28,"x": -212, "y":64}
index.html
<!DOCTYPE html>
<html lang="ja">
<head>
<meta charset="utf-8">
<title>MQTT Receive</title>
<script src="https://cdnjs.cloudflare.com/ajax/libs/paho-mqtt/1.1.0/paho-mqtt.js"></script>
<script src="https://d3js.org/d3.v7.min.js"></script>
<script src="mqtt_receive.js"></script>
<script src="draw_graph.js"></script>
</head>
<body>
<div class="contents">
<table>
<tr>
<th>count</th>
<th>x</th>
<th>y</th>
<th>時刻</th>
</tr>
<tr>
<td><div id="count">---</id></td>
<td><div id="x">---</id></td>
<td><div id="y">---</id></td>
<td><div id="timex">---</id></td>
</tr>
</table>
</div>
<hr />
<div id="outarea_aa">outarea_aa</div>
<div id="outarea_bb">outarea_bb</div>
<div id="outarea_cc">outarea_cc</div>
<div id="outarea_dd">outarea_dd</div>
<div id="outarea_ee">outarea_ee</div>
<div id="outarea_ff">outarea_ff</div>
<div id="outarea_gg">outarea_gg</div>
<div id="outarea_hh">outarea_hh</div>
<hr />
<br />
<blockquote>
Version: Feb/05/2025<br />
</blockquote>
</body>
</html>
mqtt_receive.js
// ---------------------------------------------------------------
//	mqtt_receive.js
//
//						Feb/05/2025
//
// ---------------------------------------------------------------
'use strict'
// ---------------------------------------------------------------
var mqtt;
const reconnectTimeout = 2000;
const host="example.com"
const port=8080
const topic = "compass/test"

const width = 600 // グラフの幅
const height = 600 // グラフの高さ
const margin = { "top": 50, "bottom": 50, "right": 50, "left": 50 }
vaar xScale
var yScale

var svg
// ---------------------------------------------------------------
window.onload = ()=>
{
	document.querySelector("#outarea_aa").innerHTML =
		"*** mqtt_receive.js *** start ***"

	svg = draw_graph_proc()

	MQTTconnect()

	document.querySelector("#outarea_hh").innerHTML =
		"*** mqtt_receive.js *** end ***"
}

// ---------------------------------------------------------------
function onFailure(message)
{
	console.log("Connection Attempt to Host "+host+"Failed");
	setTimeout(MQTTconnect, reconnectTimeout);
}

// ---------------------------------------------------------------
function onMessageArrived(msg)
{
	console.log("*** onMessageArrived ***")
	var out_msg="Message received "+msg.payloadString+"<br>"
	out_msg=out_msg+"Message received Topic "+msg.destinationName
	console.log(out_msg)

	const str_out = "<p>" + msg.payloadString + "</p>"
	document.querySelector("#outarea_cc").innerHTML = str_out

	const json_str = msg.payloadString
	const unit_aa = JSON.parse(json_str)

	const nowx = new Date()
	document.querySelector("#outarea_ff").innerHTML = "check aaa"

	const Year = nowx.getFullYear()

	const Month = nowx.getMonth()+1
	const Datex = nowx.getDate()
	const Hour = nowx.getHours()
	const Min = nowx.getMinutes()
	const Sec = nowx.getSeconds()

	const ddx = Year + "年" + Month + "月" + Datex + "日" + Hour + ":" + Min + ":" + Sec

	document.querySelector("#count").innerHTML = ""+ unit_aa["count"] + " "
	document.querySelector("#x").innerHTML = ""+ unit_aa["x"] + " "
	document.querySelector("#y").innerHTML = ""+ unit_aa["y"] + " "
	document.querySelector("#timex").innerHTML = ddx
	document.querySelector("#outarea_dd").innerHTML = ddx

	const dataset = [[unit_aa["x"],unit_aa["y"]]]
	point_append_proc(svg,dataset,"green")
}

// ---------------------------------------------------------------
function onConnect() {
	  // Once a connection has been made, make a subscription and send a message.

	document.querySelector("#outarea_bb").innerHTML = "*** Connected ***"
	console.log("Connected ")

	mqtt.subscribe(topic)

//	  message = new Paho.MQTT.Message("Hello World")
//	  message.destinationName = "sensor2"
//	  message.retained=true
//	  mqtt.send(message)
	  }

// ---------------------------------------------------------------
function MQTTconnect()
{
	console.log("connecting to "+ host +" "+ port)
	var x=Math.floor(Math.random() * 10000)
	var cname="orderform-"+x
	mqtt = new Paho.Client(host,port,cname)
	var options = {
			timeout: 3,
			onSuccess: onConnect,
			onFailure: onFailure,
			 }
	mqtt.onMessageArrived = onMessageArrived

	mqtt.connect(options)

	console.log("*** MQTTconnect end ***")
}

// ---------------------------------------------------------------
draw_graph.js
// -----------------------------------------------------------------------
//	draw_graph.js
//
//						Feb/05/2022
// -----------------------------------------------------------------------
'use strict'
// -----------------------------------------------------------------------
/*
const width = 600 // グラフの幅
const height = 600 // グラフの高さ
const margin = { "top": 50, "bottom": 50, "right": 50, "left": 50 }
var xScale
var yScale
*/
// -----------------------------------------------------------------------
function draw_graph_proc()
{
	// 2. SVG領域の設定
	var svg = d3.select(".contents").append("svg").attr("width", width).attr("height", height);

	// 3. 軸スケールの設定
	xScale = d3.scaleLinear()
		.domain([-600, 600])
		.range([margin.left, width - margin.right]);

	yScale = d3.scaleLinear()
		.domain([-600, 600])
		.range([height - margin.bottom, margin.top]);

	// 4. 軸の表示
	var axisx = d3.axisBottom(xScale).ticks(10).tickSize(-500);
	var axisy = d3.axisLeft(yScale).ticks(10).tickSize(-500);

	svg.append("g")
		.attr("transform", "translate(" + 0 + "," + (height - margin.bottom) + ")")
		.call(axisx)
		.append("text")
		.attr("fill", "black")
		.attr("x", (width - margin.left - margin.right) / 2 + margin.left)
		.attr("y", 35)
		.attr("text-anchor", "middle")
		.attr("font-size", "10pt")
		.attr("font-weight", "bold")
		.text("X Axis");

	svg.append("g")
		.attr("transform", "translate(" + margin.left + "," + 0 + ")")
		.call(axisy)
		.append("text")
		.attr("fill", "black")
		.attr("x", -(height - margin.top - margin.bottom) / 2 - margin.top)
		.attr("y", -35)
		.attr("transform", "rotate(-90)")
		.attr("text-anchor", "middle")
		.attr("font-weight", "bold")
		.attr("font-size", "10pt")
		.text("Y Axis");

	return svg
}

// -----------------------------------------------------------------------
function point_append_proc(svg,dataset,color)
{
	// 5. プロットの表示
	svg.append("g")
		.selectAll("circle")
		.data(dataset)
		.enter()
		.append("circle")
		.attr("cx", function(d) { return xScale(d[0]); })
		.attr("cy", function(d) { return yScale(d[1]); })
		.attr("fill", color)
		.attr("r", 8);
}

// -----------------------------------------------------------------------
テストスクリプト
go_publish.sh
mosquitto_pub -d -t orz -m '{"count": 28,"x": -212, "y":64}' \
	-h example.com --topic compass/test