こちらと同じデータを使って、色々なグラフを作成します。
Rstudio で折れ線グラフを作図
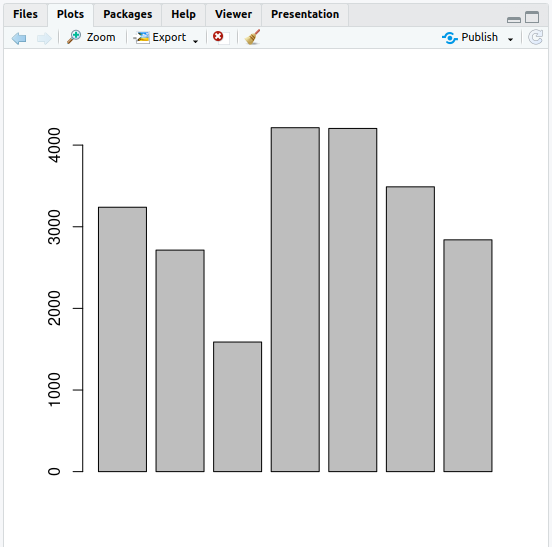
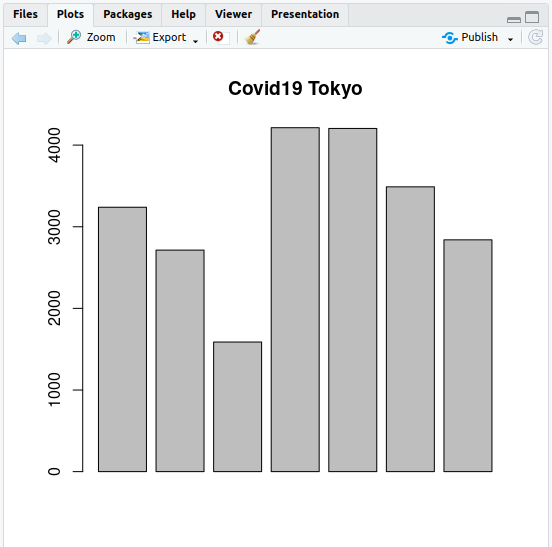
棒グラフ
> tokyo <- c(3239,2714,1588,4213,4204,3489,2840)
> barplot(tokyo)
> barplot(tokyo, main="Covid19 Tokyo")
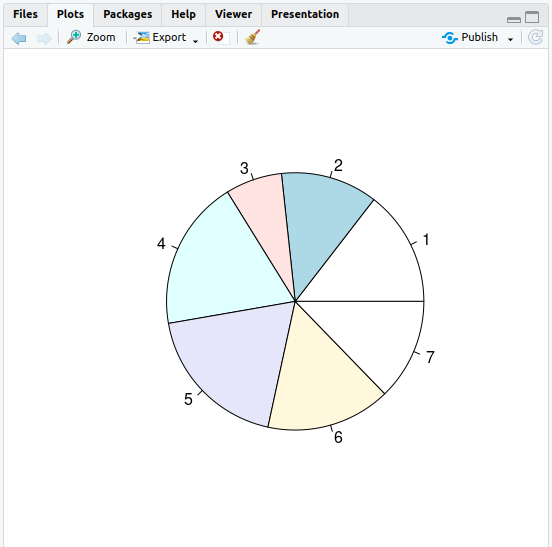
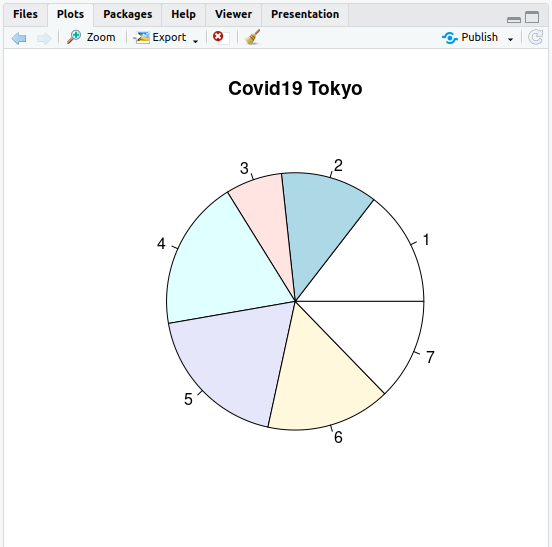
円グラフ
> pie(tokyo)
> pie(tokyo, main="Covid19 Tokyo")
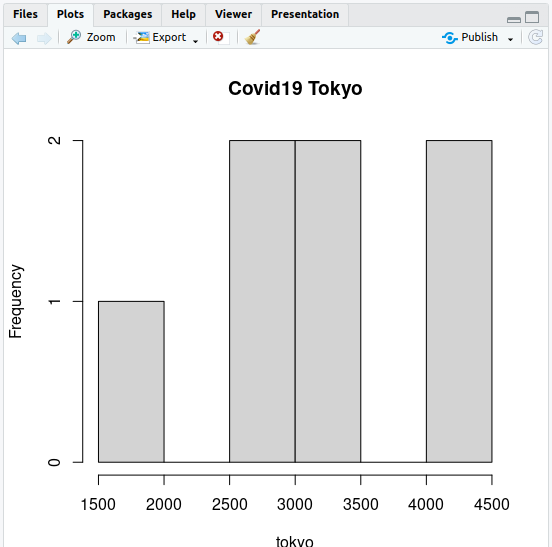
ヒストグラム
> hist(tokyo)
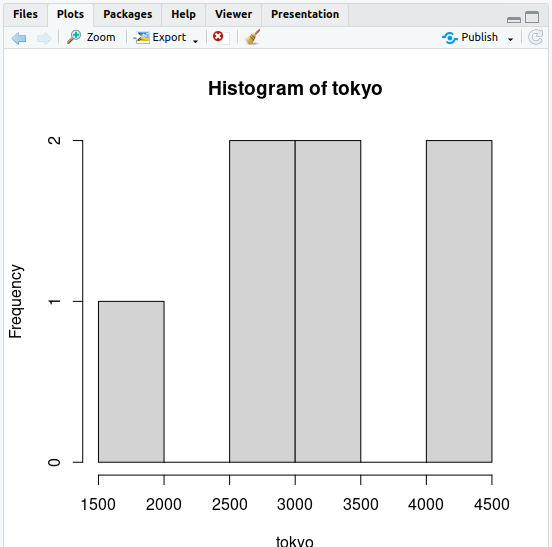
> hist(tokyo, main="Covid19 Tokyo")