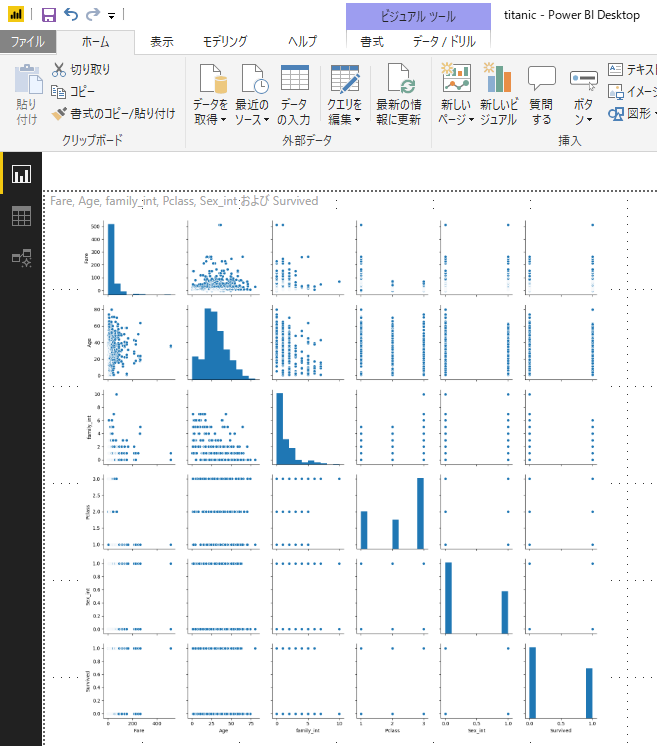
Microsoft Power BI でPythonビジュアルが使えそうなので、seabornのpairplotしたかったけどてこずったのでメモ。
環境
- Microsoft Windows 10 バージョン 1803(OS ビルド 17134.556)
- Microsoft Power BI Desktop バージョン: 2.68.5432.841 64-bit (2019年4月)
- Python 3.7.2
Pythonまわり
まずPythonの必要なライブラリが入ってなかった。
cmd
>pip list
Package         Version
--------------- -------
pip             19.1.1
pip installでSSLのエラーに悩まされる。プロキシの問題?と思ったり諦めかけたそのとき。
cmd
>pip install pandas
 (略)
Could not fetch URL https://pypi.org/simple/pandas/: There was a problem confirming the ssl certificate: HTTPSConnectionPool(host='pypi.org', port=443): Max retries exceeded with url: /simple/pandas/ (Caused by SSLError(SSLCertVerificationError(1, '[SSL: CERTIFICATE_VERIFY_FAILED] certificate verify failed: unable to get local issuer certificate (_ssl.c:1056)'))) - skipping
pipのオプションで証明書を受け入れる指定ができるらしい。
cmd
>pip install pandas  --trusted-host pypi.org --trusted-host files.pythonhosted.org
Collecting pandas
 (略)
Installing collected packages: pytz, numpy, six, python-dateutil, pandas
Successfully installed numpy-1.16.3 pandas-0.24.2 python-dateutil-2.8.0 pytz-2019.1 six-1.12.0
同様にseabornも。
cmd
>pip install seaborn --trusted-host pypi.org --trusted-host files.pythonhosted.org
必要なのは入ったぽい。
cmd
>pip list
Package         Version
--------------- -------
cycler          0.10.0
kiwisolver      1.1.0
matplotlib      3.0.3
numpy           1.16.3
pandas          0.24.2
pip             19.1.1
pyparsing       2.4.0
python-dateutil 2.8.0
pytz            2019.1
scipy           1.2.1
seaborn         0.9.0
setuptools      40.6.2
six             1.12.0
PowerBI側
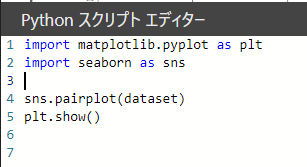
Power BI Desktopのレポート作成画面にPythonビジュアルを置き、Pythonスクリプトエディターにコードを貼り付ける。
Pythonスクリプトエディター
import matplotlib.pyplot as plt
import seaborn as sns

sns.pairplot(dataset)
plt.show()
 ←Pythonビジュアル
 ←Pythonスクリプトエディター
無慈悲なエラー
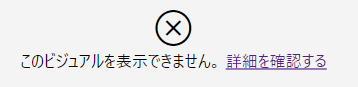
「詳細を確認する」
詳細
 (略)
ModuleNotFoundError: No module named 'matplotlib'
 (略)
なんと、入れたはずのmatplotlibがないというではないか。ここまでか。ついにあきらめかけたそのとき。
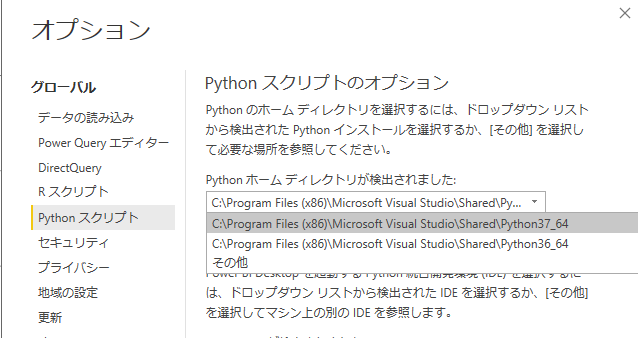
Power BI DesktopのオプションでPythonのパスを設定できることが判明。(Pythonが2つ入ってることも判明!)
36_64→37_64に変更して無事表示できるようになった。やれやれ。
こちらの記事を参考にしました。(リスペクト)
https://qiita.com/agajo/items/73d6f14855da703972e0
https://qiita.com/h_kobayashi1125/items/afc55abf7e98581bcab3
https://qiita.com/h_kobayashi1125/items/e10986ff223306ed9f2f