目的
ReactとChart.jsでグラフを描画するの続きになります。
「react-chartjs-2」を使いReactアプリケーションでの複数グラフの実装方法の手順を理解していきます。
【公式サイト】
Chart.js:https://www.chartjs.org/
react-chartjs-2:https://github.com/jerairrest/react-chartjs-2
【続きもの】
ReactとChart.jsでグラフを描画する
ReactとChart.jsでグラフを複数描画する <- now
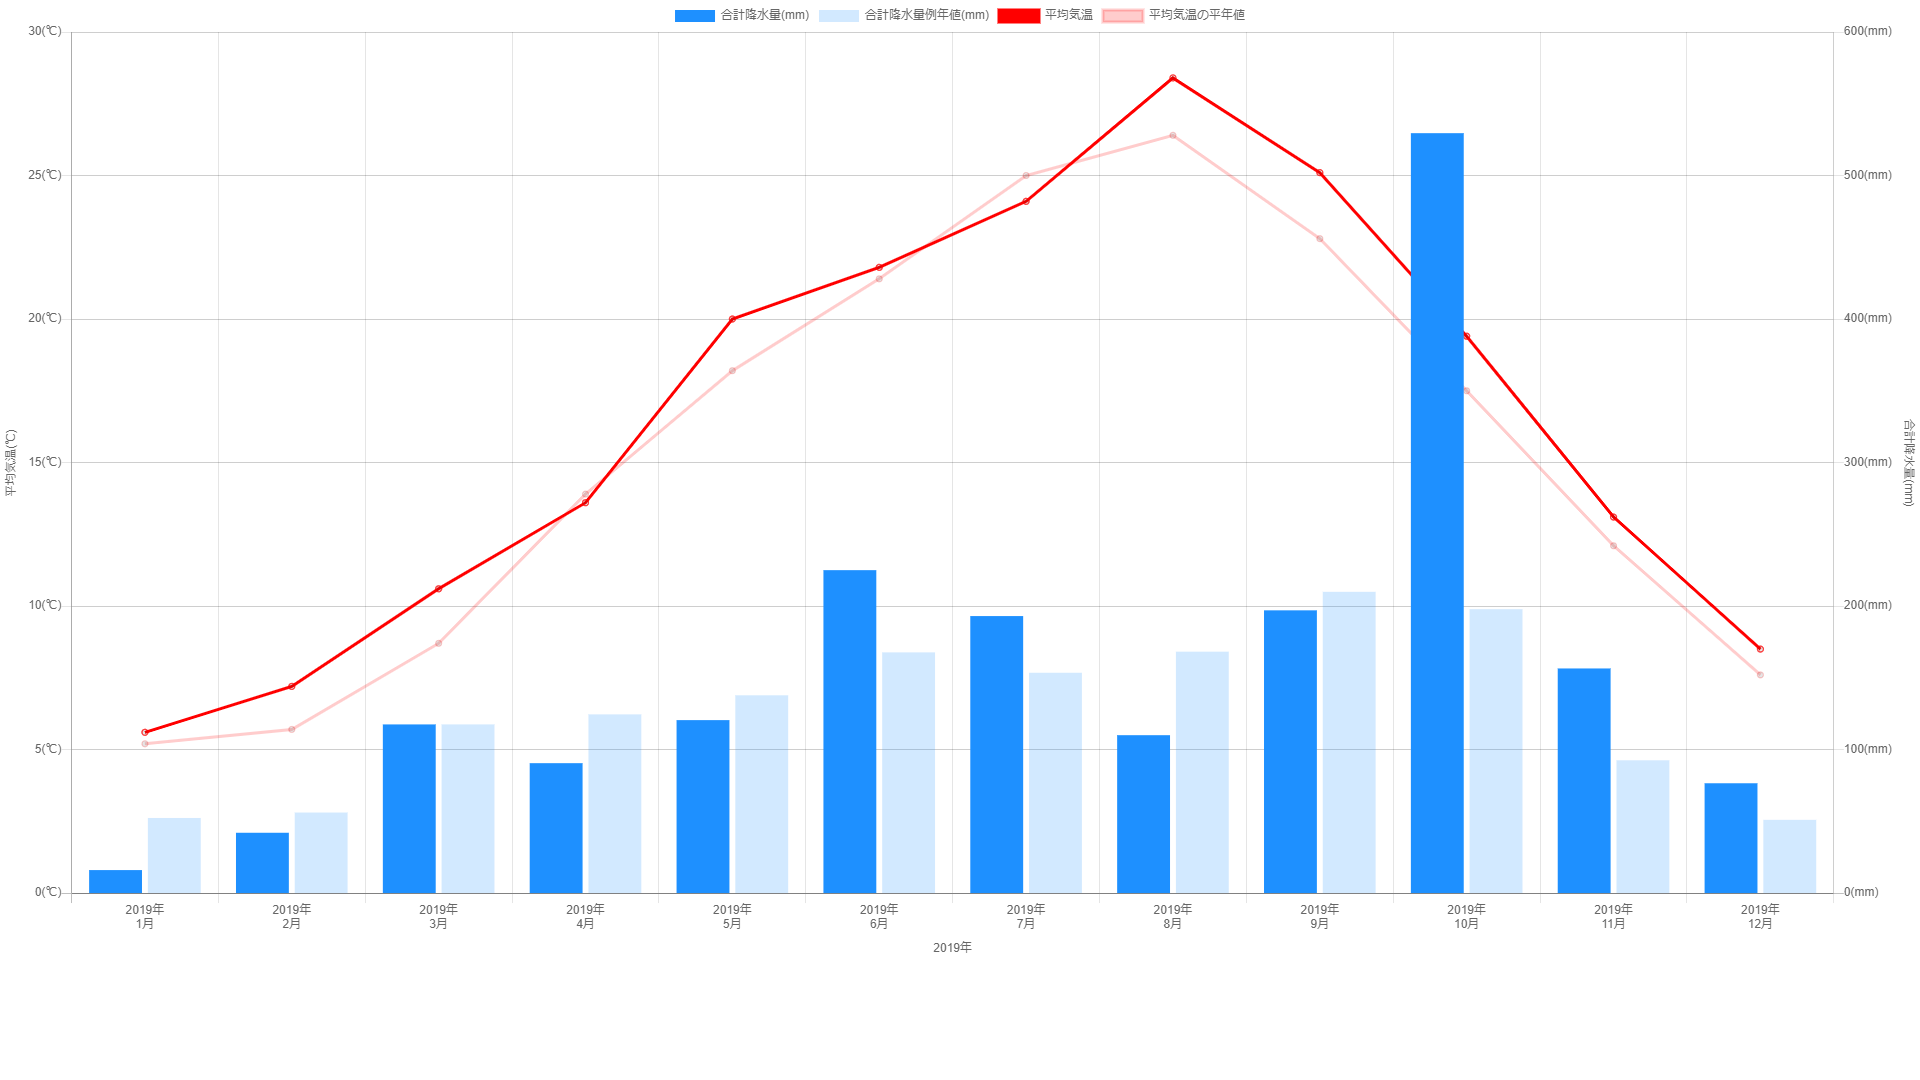
完成イメージ
表示データ:2019年の東京の「降水量の月合計」「降水量の月合計の平年値」「月平均気温」「月平均気温の平年値」

実装結果だけ見たい方はこちらへ↓
コード
実装
実装の準備については前回の記事を参考にしてください。
早速実装に入ります。
今回表示するデータは2019年の東京の「降水量の月合計」「降水量の月合計の平年値」「月平均気温」「月平均気温の平年値」
同種のグラフを追加
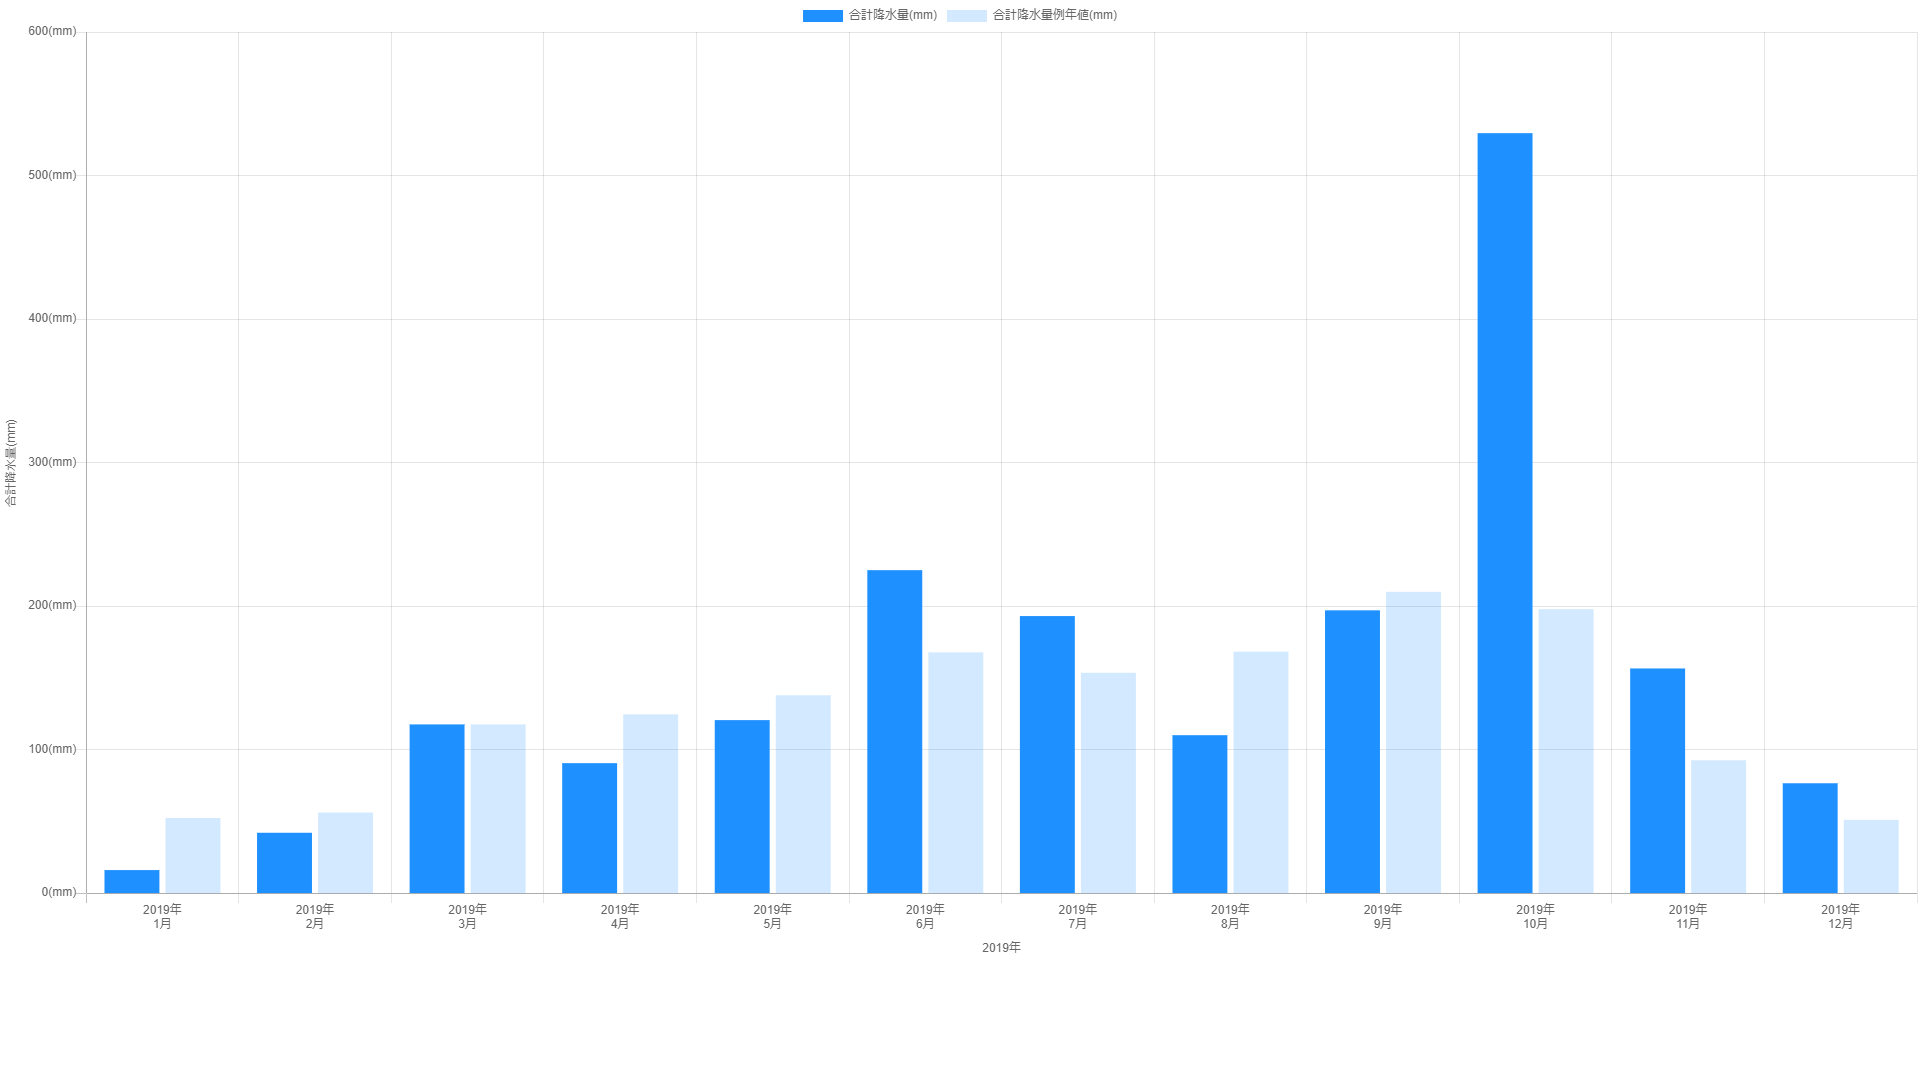
まず、既にグラフに表示されている「降水量の月合計」と同じx軸y軸をもつ「降水量の月合計の平年値」から追加していきます。
この場合、データセットに表示したいデータを追加すればOK
import React from 'react';
import { Bar } from 'react-chartjs-2';
import './App.css';

function App() {
  /** グラフデータ */
  const graphData = {
    labels: [
      // (省略)
    ],
    datasets: [
      {
        data: [16, 42, 117.5, 90.5, 120.5, 225, 193, 110, 197, 529.5, 156.5, 76.5],
        backgroundColor: 'rgba(30, 144, 255, 1)',
        label: '合計降水量(mm)',
      },
      {
        // データセットを追加
        data: [52.3, 56.1, 117.5, 124.5, 137.8, 167.7, 153.5, 168.2, 209.9, 197.8, 92.5, 51],
        backgroundColor: 'rgba(30, 144, 255, 0.2)',
        label: '合計降水量例年値(mm)',
      },
    ],
  };

  /** グラフオプション */
  const graphOption = {
      // (省略)
  };

  return (
    <div className="App">
      {/* グラフコンポーネントの呼び出し */}
      <Bar data={graphData} options={graphOption} />
    </div>
  );
}

export default App;
画面はこんな感じ。
異なるグラフを追加
次に「月平均気温」「月平均気温の平年値」を折れ線グラフで追加してみます。
降水量と気温ではy軸の単位が異なるのでそれぞれ別軸として処理できるようにします。
この場合、データセット及びグラフオプションに設定が必要になるので、それぞれについて見ていきましょう。
まずはググラフオプションからです。こんな感じ。
  /** グラフオプション */
  const graphOption = {
    scales: {
      xAxes: [
        {
          scaleLabel: {
            display: true,
            labelString: '2019年',
          },
        },
      ],
      yAxes: [
        {
          id: 'y-axis-precipitation', // idを追加
          position: 'right', // 表示ポジションの設定を追加
          scaleLabel: {
            display: true,
            labelString: '合計降水量(mm)',
          },
          ticks: {
            beginAtZero: true,
            callback: function (value, index, values) {
              return `${value}(mm)`;
            },
          },
        },
        {
          // 気温用の軸を追加
          id: 'y-axis-temperature',
          position: 'left',
          scaleLabel: {
            display: true,
            labelString: '平均気温(℃)',
          },
          ticks: {
            beginAtZero: true,
            callback: function (value, index, values) {
              return `${value}(℃)`;
            },
          },
        },
      ],
    },
  };
x軸については前回からの変更点はありません。重要なのは区別を付けたいy軸についての設定です。
ここではy軸オプション(yAxes)に従来の「降水量」用のオプションと新しく「気温」用のオプションを追加しています。
この際、それぞれを区別するためのidを任意で付加しています。(←大事)
ついでに表示ポジションの設定も追加しています。
次にデータセットの方を見ていきましょう
  const graphData = {
    labels: [
      // (省略)
    ],
    datasets: [
      {
        type: 'bar', // グラフタイプを指定
        yAxisID: 'y-axis-precipitation', // y軸idを指定
        data: [16, 42, 117.5, 90.5, 120.5, 225, 193, 110, 197, 529.5, 156.5, 76.5],
        backgroundColor: 'rgba(30, 144, 255, 1)',
        label: '合計降水量(mm)',
      },
      {
        type: 'bar', // グラフタイプを指定
        yAxisID: 'y-axis-precipitation', // y軸idを指定
        data: [52.3, 56.1, 117.5, 124.5, 137.8, 167.7, 153.5, 168.2, 209.9, 197.8, 92.5, 51],
        backgroundColor: 'rgba(30, 144, 255, 0.2)',
        label: '合計降水量例年値(mm)',
      },
      {
        type: 'line', // グラフタイプを指定
        yAxisID: 'y-axis-temperature', // y軸idを指定
        data: [5.6, 7.2, 10.6, 13.6, 20, 21.8, 24.1, 28.4, 25.1, 19.4, 13.1, 8.5],
        label: '平均気温',
        lineTension: 0,
        fill: false,
        borderColor: 'rgba(255, 0, 0, 1)',
      },
      {
        type: 'line', // グラフタイプを指定
        yAxisID: 'y-axis-temperature', // y軸idを指定
        data: [5.2, 5.7, 8.7, 13.9, 18.2, 21.4, 25, 26.4, 22.8, 17.5, 12.1, 7.6],
        label: '平均気温の平年値',
        lineTension: 0,
        fill: false,
        borderColor: 'rgba(255, 0, 0, 0.2)',
      },
    ],
  };
ここで表示したいデータセットは「降水量の月合計」「降水量の月合計の平年値」「月平均気温」「月平均気温の平年値」の4つです。
それぞれにグラフの見た目に対するプロパティもありますが、重要なのは以下の3つ。
| type | yAxisID | data |
|---|---|---|
| グラフのタイプ | グラフオプションで設定したy軸id | 表示するデータ |
以上の設定を行うとグラフはこんな感じになる。
まとめ
グラフを複数描画するのにも、それらのグラフが同種類なのか別種類なのかで必要な処理が変わってきます。
今回と同様にすれば、他にも様々な種類の混合グラフを作成することができます。
最後に全体のコードを載せておきます。
コード
import React from 'react';
import { Bar } from 'react-chartjs-2';
import './App.css';

function App() {
  /** グラフデータ */
  const graphData = {
    labels: [
      ['2019年', '1月'],
      ['2019年', '2月'],
      ['2019年', '3月'],
      ['2019年', '4月'],
      ['2019年', '5月'],
      ['2019年', '6月'],
      ['2019年', '7月'],
      ['2019年', '8月'],
      ['2019年', '9月'],
      ['2019年', '10月'],
      ['2019年', '11月'],
      ['2019年', '12月'],
    ],
    datasets: [
      {
        type: 'bar',
        yAxisID: 'y-axis-precipitation',
        data: [16, 42, 117.5, 90.5, 120.5, 225, 193, 110, 197, 529.5, 156.5, 76.5],
        backgroundColor: 'rgba(30, 144, 255, 1)',
        label: '合計降水量(mm)',
      },
      {
        type: 'bar',
        yAxisID: 'y-axis-precipitation',
        data: [52.3, 56.1, 117.5, 124.5, 137.8, 167.7, 153.5, 168.2, 209.9, 197.8, 92.5, 51],
        backgroundColor: 'rgba(30, 144, 255, 0.2)',
        label: '合計降水量例年値(mm)',
      },
      {
        type: 'line',
        yAxisID: 'y-axis-temperature',
        data: [5.6, 7.2, 10.6, 13.6, 20, 21.8, 24.1, 28.4, 25.1, 19.4, 13.1, 8.5],
        label: '平均気温',
        lineTension: 0,
        fill: false,
        borderColor: 'rgba(255, 0, 0, 1)',
      },
      {
        type: 'line',
        yAxisID: 'y-axis-temperature',
        data: [5.2, 5.7, 8.7, 13.9, 18.2, 21.4, 25, 26.4, 22.8, 17.5, 12.1, 7.6],
        label: '平均気温の平年値',
        lineTension: 0,
        fill: false,
        borderColor: 'rgba(255, 0, 0, 0.2)',
      },
    ],
  };

  /** グラフオプション */
  const graphOption = {
    scales: {
      xAxes: [
        {
          scaleLabel: {
            display: true,
            labelString: '2019年',
          },
        },
      ],
      yAxes: [
        {
          id: 'y-axis-precipitation',
          position: 'right',
          scaleLabel: {
            display: true,
            labelString: '合計降水量(mm)',
          },
          ticks: {
            beginAtZero: true,
            callback: function (value, index, values) {
              return `${value}(mm)`;
            },
          },
        },
        {
          id: 'y-axis-temperature',
          position: 'left',
          scaleLabel: {
            display: true,
            labelString: '平均気温(℃)',
          },
          ticks: {
            beginAtZero: true,
            callback: function (value, index, values) {
              return `${value}(℃)`;
            },
          },
        },
      ],
    },
  };

  return (
    <div className="App">
      {/* グラフコンポーネントの呼び出し */}
      <Bar data={graphData} options={graphOption} />
    </div>
  );
}

export default App;
