はじめに
この記事は 富士通クラウドテクノロジーズ Advent Calendar 2023 の 17 日目の記事です。
昨日は@fuku2014(@seumo)さんの「Terraform小ネタ集」という記事でした。
自分も今業務でTerraformを使ってニフクラ環境を構築しているため、是非ともこの小ネタを使ってみたいですね ![]()
さて、みなさんはPrometheus使っていますか?
自分は最近Prometheusを知り、実際のシステムに対しても使ってみたいな〜と思って色々勉強中です。
そんな勉強中に思ったことが...
- 実際のシステムを監視するにあたって、CPUやメモリ、ディスク、ネットワークなどの値を見たい
- 検索するとさまざまなPromQLのパラメータの値が見つかる
- これ、どれが正しいの?
- 取得してきた値って本当に正しいの?
- 確かめてみたいかも
そんなことを思いまして、実際に確かめてみよう!と調べてみました。
今回使う技術
今回使う技術について軽く書きます。
Prometheus
Prometheusはモニタリングやアラートに関する基盤として利用することができるOSSです(元はSoundCloudのエンジニアが開発した)。 2016年にCloud Native Computing Foundation Projectに加わり、現在はGraduatedとなっています。
Prometheusは主にKubernetesで利用されることが多く、理由としてサービスディスカバリにより動的に監視対象が追加できるというのがあると思います。KubernetesではPodのスケーリングなどで動的にホストが変更することが多いですからね。
Node Exporter
CPUやメモリ、ディスク、ネットワークなどの値
これらをシステムから取得するには、Prometheusのデータ取得のために用いるexporterではNode Exporterを活用するのがよさそうです。
Node ExporterはハードウェアやOSのメトリクスを取得するために利用できます。
PromQL
Prometheusが提供するメトリクスのクエリ言語で、多次元的にラベルがつけられた時系列データに対して様々な計算を適用可能になっています。
こちらの記述によって、GrafanaなどでPrometheusで取得したデータの可視化を行えます。
このチートシートがいいらしい
kube-prometheus-stack
KubernetesクラスタにPrometheusをインストールする方法のひとつです。
以下のようなコンポーネントをまとめてインストールすることができ、 各種設定もvalues.yamlで宣言的におこなうことができるため、導入/管理が比較的かんたんに実現できます。
- Prometheus
- Grafana
- AlertManager
- kube-state-metrics
- Node Exporter
- Prometheus Operator
比較してみた
実際にNode Exporterで取得した値とnode上でコマンドを用いて取得した値を比較していこうと思います。
Linuxでリソースの値を調べるコマンドといえば...
-
top,htop vmstatiostatdstatnetstatfreesardf
などなど、列挙してみるだけでもいっぱいありますね。
今回は以下のコマンドで調べた値と比較してみたいと思います。
vmstat 1 --wide --timestamp
dstat --cpu --mem --disk --net --time
Linuxコマンド実行結果(Nodeのパフォーマンス)
PrometheusのNode exporterが動作している(Prometheusでも状況を収集している)Nodeで先ほど挙げたコマンドを用いてパフォーマンスを取得した結果が以下になります。
(Timeが若干バラバラなのは、自分が気づいたタイミングで取得したため&多少値にバラつきがあるように抽出したためで特に深い意味はないです ![]() )
)
ubuntu@example-k8s:~$ vmstat 1 --wide --timestamp
--procs-- -----------------------memory---------------------- ---swap-- -----io---- -system-- --------cpu-------- -----timestamp-----
   r    b         swpd         free         buff        cache   si   so    bi    bo   in   cs  us  sy  id  wa  st                 JST
   0    0            0       197028        62372      2019592    0    0     0     0 1222 2398   4   1  96   0   0 2023-12-16 20:30:00
・・・
   0    0            0       200832        63732      2038180    0    0     0     0 1333 2637   1   0  99   0   0 2023-12-16 21:00:00
・・・
   0    0            0       152560        64380      2063300    0    0     0     0 1504 2946   2   2  97   0   0 2023-12-16 21:15:00
・・・
   7    0            0        75888        65272      2081920    0    0     0    40 1302 2532   1   0  98   0   0 2023-12-16 22:15:00
ubuntu@example-k8s:~$ dstat --cpu --mem --disk --net --time
--total-cpu-usage-- ------memory-usage----- -dsk/total- -net/total- ----system----
usr sys idl wai stl| used  free  buff  cach| read  writ| recv  send|     time
  3   0  97   0   0|1689M  192M 60.9M 1759M|   0     0 |3002B 3438B|16-12 20:30:00
・・・
  1   0  99   0   0|1666M  196M 62.2M 1778M|   0     0 |3002B 4496B|16-12 21:00:00
・・・
  1   1  97   0   0|1688M  149M 62.9M 1802M|   0     0 |8228B 5098B|16-12 21:15:00
・・・
  1   1  98   0   0|1744M 74.1M 63.7M 1820M|   0    40k|3120B 3796B|16-12 22:15:00
それぞれの値の意味を全部書くのは面倒なので、参考にChatGPTくんに聞いてみることにしました!
vmstatコマンドの出力は、システムの仮想メモリ、プロセス、I/O、CPUなどの情報を表示します。以下に、各列の意味を説明します:

r: 実行待ちのプロセス数。ランキューに待っているが、CPUが利用可能でないために実行できないプロセス数です。

b: ブロックされたプロセス数。ディスクI/Oなどの待機中のブロッキングプロセスの数です。

swpd: スワップされた仮想メモリの合計サイズ(キロバイト)。

free: 使用可能な物理メモリのサイズ(キロバイト)。

buff: バッファキャッシュに使われているメモリのサイズ(キロバイト)。

cache: ページキャッシュに使われているメモリのサイズ(キロバイト)。

si: スワップイン(キロバイト/秒)。ディスクからメモリに読み込まれるスワップサイズを示します。

so: スワップアウト(キロバイト/秒)。メモリからディスクに書き込まれるスワップサイズを示します。

bi: ブロックイン(ブロック/秒)。ディスクからメモリに読み込まれるブロックの数を示します。

bo: ブロックアウト(ブロック/秒)。メモリからディスクに書き込まれるブロックの数を示します。

in: 割り込みの数(1秒間の数)。

cs: コンテキストスイッチの数(1秒間の数)。

us: ユーザ空間でCPUが使用されている割合。

sy: システム空間でCPUが使用されている割合。

id: アイドル状態であるCPUの割合。

wa: ディスクI/Oを待っているCPUの割合。

st: ハイパーバイザによる仮想CPUのスティール時間の割合(仮想化環境でのみ表示されます)。

timestamp: タイムスタンプ。各行のデータが取得された時刻。
dstatコマンドの出力には、CPU、メモリ、ディスク、ネットワークなどの異なるリソースの使用状況に関する情報が含まれています。以下に、各列の意味を説明します。

--total-cpu-usage--:

usr: ユーザ空間でのCPUの使用率。
sys: システム空間でのCPUの使用率。
idl: アイドル状態のCPUの割合。
wai: I/Oの完了を待っているCPUの割合。
stl: ハイパーバイザによる仮想CPUのスティール時間の割合(仮想化環境でのみ表示されます)。
------memory-usage-----:

used: 使用中の物理メモリのサイズ。
free: 空き物理メモリのサイズ。
buff: バッファキャッシュに使用されているメモリのサイズ。
cach: ページキャッシュに使用されているメモリのサイズ。
-dsk/total-:

read: ディスクからの読み取り操作の数。
writ: ディスクへの書き込み操作の数。
-net/total-:

recv: 受信データの量。
send: 送信データの量。
----system----:

time: タイムスタンプ。
Node Exporterで取得した値
では、続いてNode Exporterで取得した値を見ていきましょう。
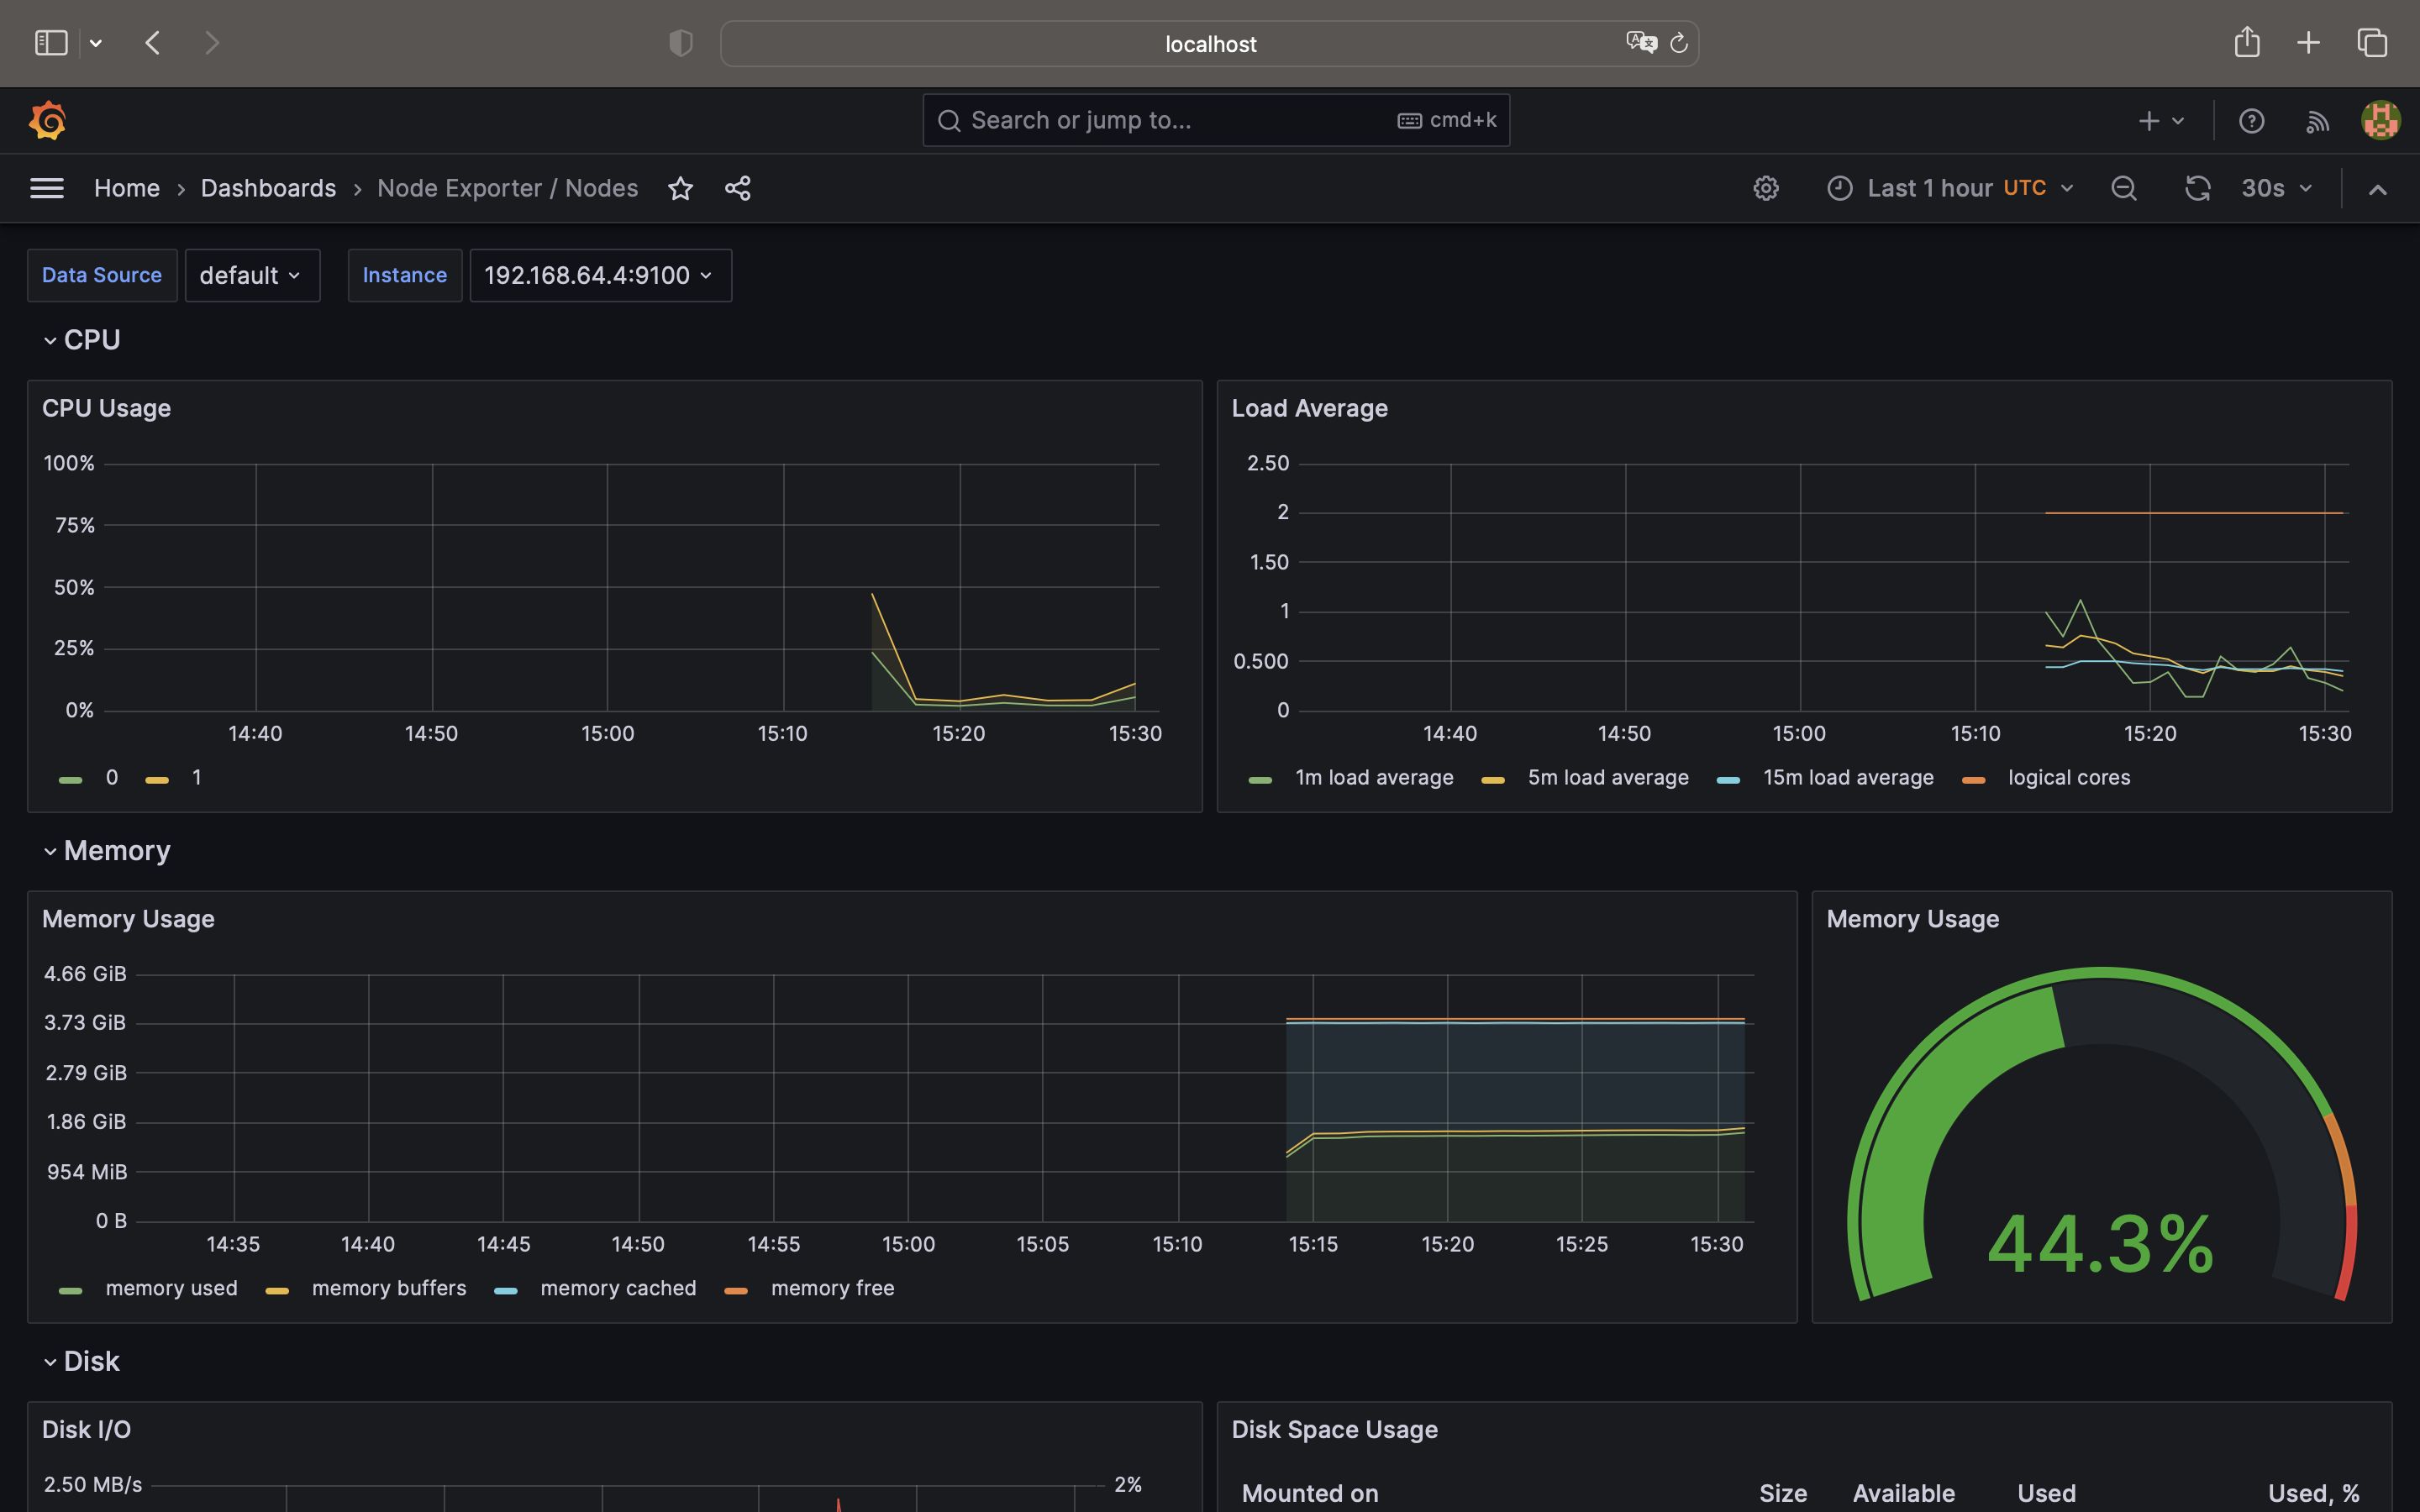
PrometheusではGrafanaを用いて値を可視化して確認するのが一般的ですが、今回利用しているkube-prometheus-stackではGrafanaもちゃんと入っていますし、しかもデフォルトでダッシュボードが登録されていて、値をすぐに確認することができます!便利〜〜!
以下に示すのが、初期状態のダッシュボードです。
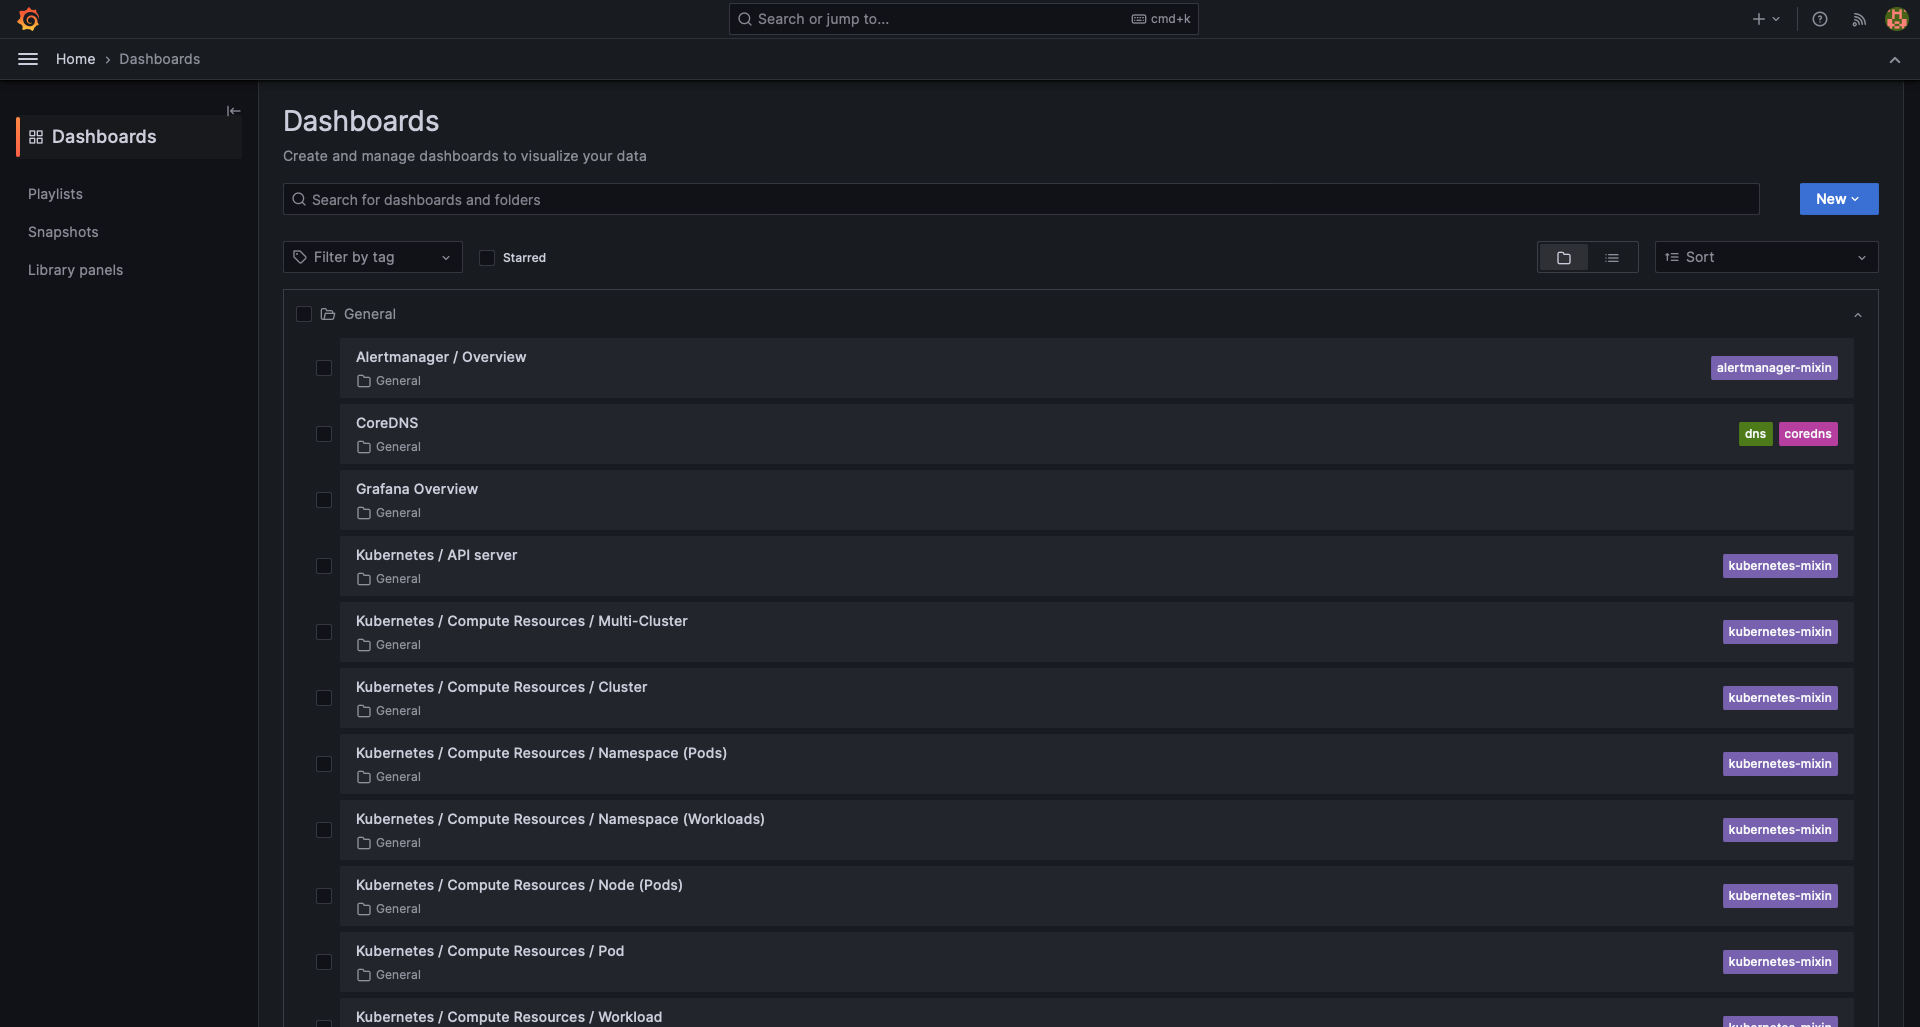
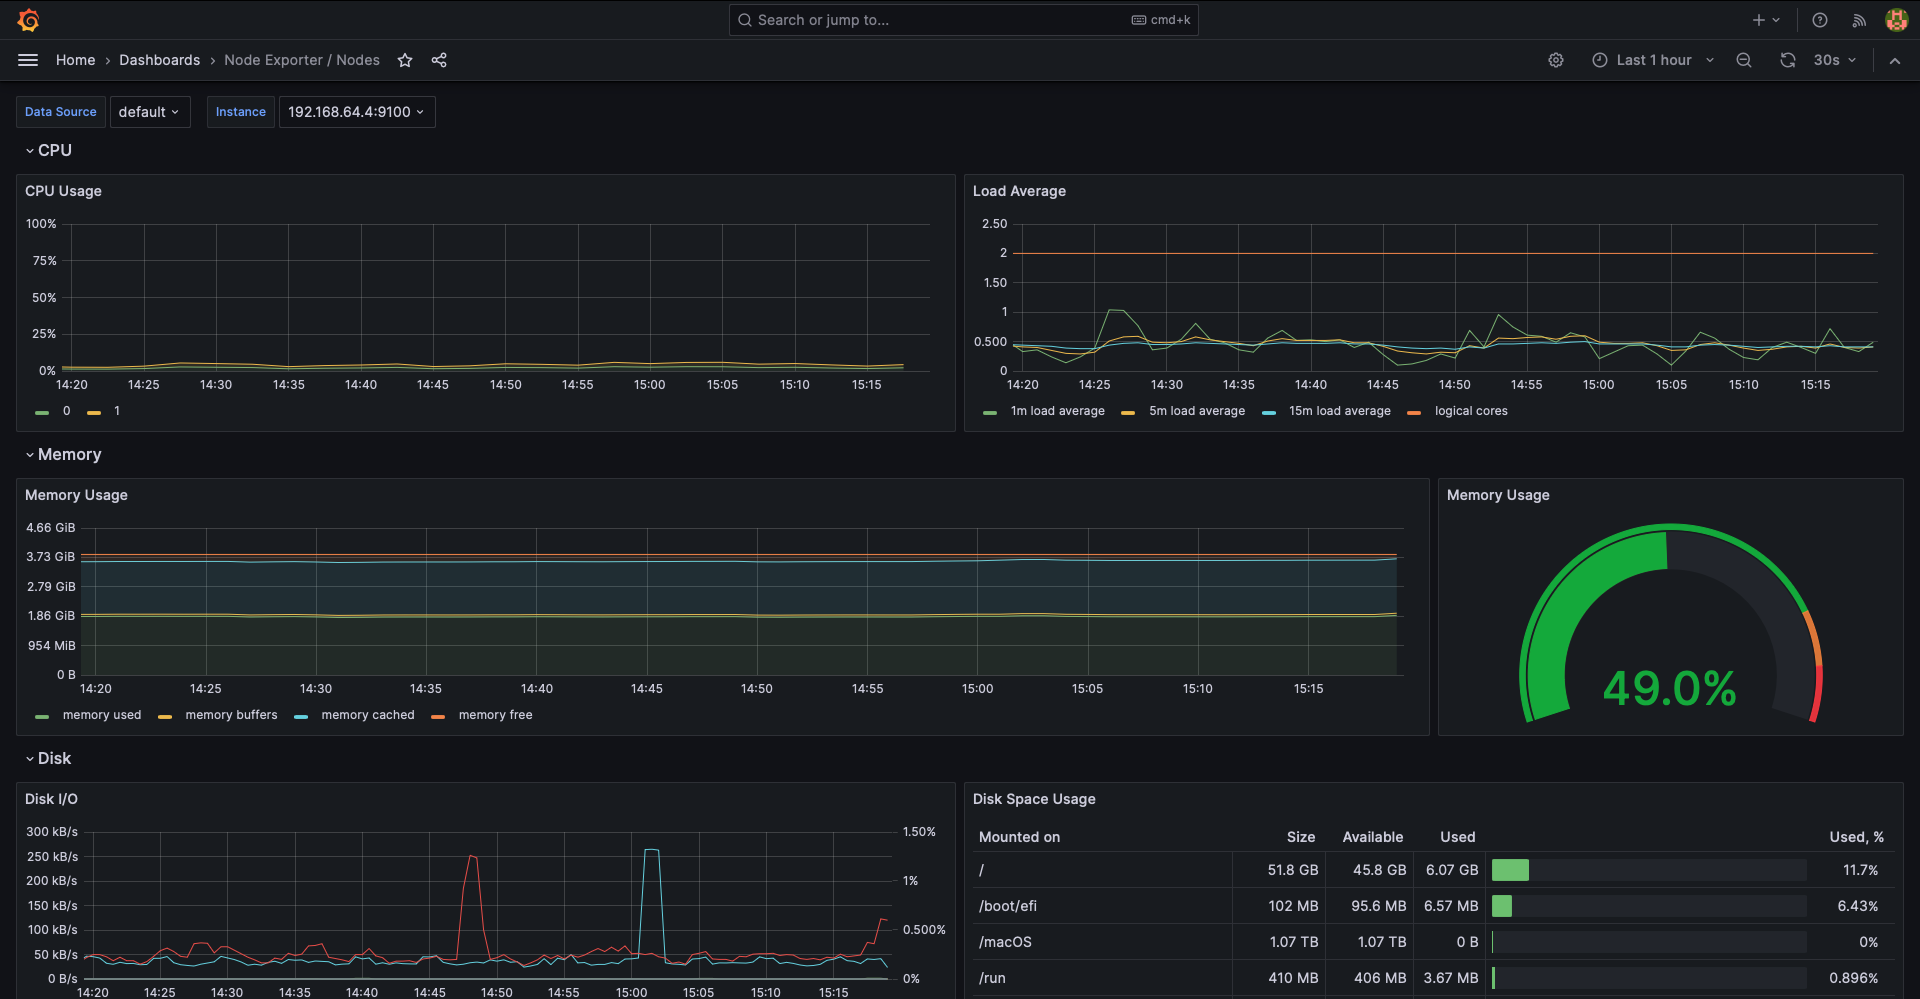
今回はこの中から、「Node Exporter / Nodes」を用いてデータを確認していきます。
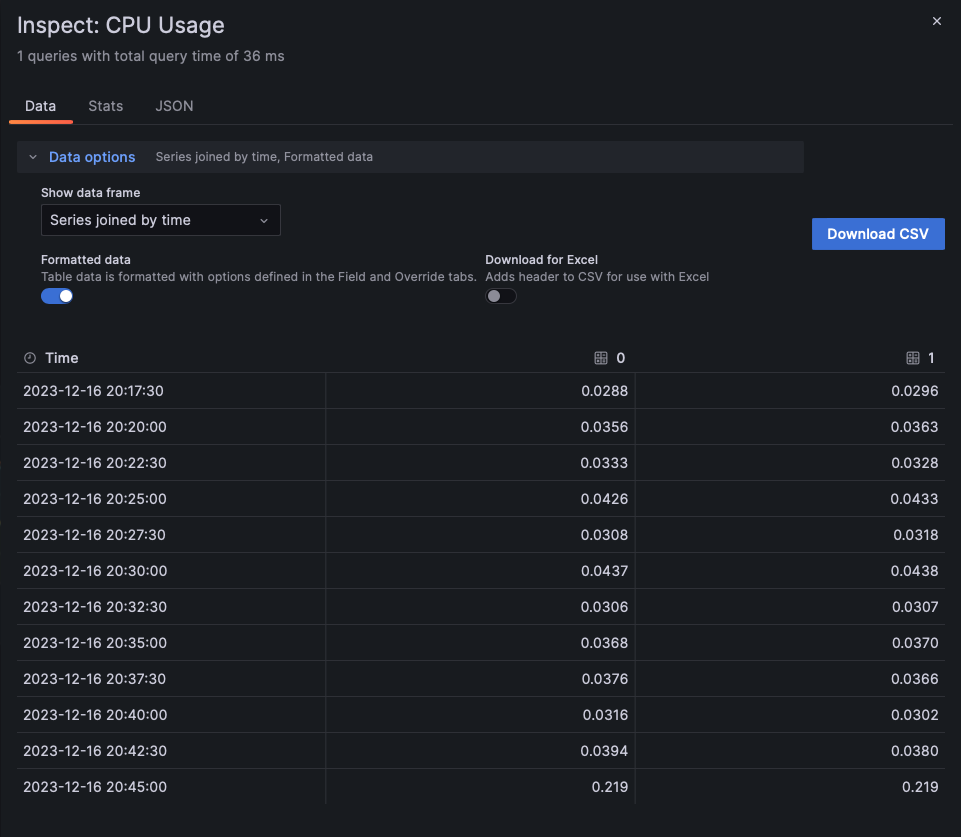
なお、データの値はそれぞれのグラフを右クリック→Inspect→Dataから表示された画面から
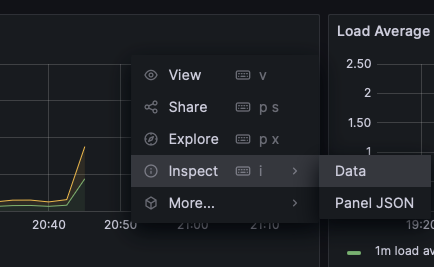
Data optionsで「Series joined by time, Formatted data」を指定して取得しています。
CPU使用率
まずはCPUから。グラフに利用されているPromQLは以下の通り。
(
  (1 - sum without (mode) (rate(node_cpu_seconds_total{job="node-exporter", mode=~"idle|iowait|steal", instance="192.168.64.4:9100"}[$__rate_interval])))
/ ignoring(cpu) group_left
  count without (cpu, mode) (node_cpu_seconds_total{job="node-exporter", mode="idle", instance="192.168.64.4:9100"})
)
取得されたデータは以下の通り。
| Time | 0 | 1 |
|---|---|---|
| 2023-12-16 20:30:00 | 0.0437 | 0.0438 |
| 2023-12-16 21:00:00 | 0.0258 | 0.0255 |
| 2023-12-16 21:15:00 | 0.0285 | 0.0277 |
| 2023-12-16 22:15:00 | 0.0302 | 0.0307 |
0と1というのは、後ほど説明しますが今回のNode環境はCPU数が2となっているためそれぞれのCPUの値ということになります。
また、Dataから%で考えると値はそれぞれ100倍したものにしてあげるとよさそうです。
そのため、それぞれのCPUの使用率は2%~4%ということになりますね(特別何かシステムを動かしている環境ではないので、低負荷ですね ![]() )
)
メモリ使用率
続いてメモリ。グラフに利用されているPromQLは以下の通り。
(
  node_memory_MemTotal_bytes{job="node-exporter", instance="192.168.64.4:9100"}
-
  node_memory_MemFree_bytes{job="node-exporter", instance="192.168.64.4:9100"}
-
  node_memory_Buffers_bytes{job="node-exporter", instance="192.168.64.4:9100"}
-
  node_memory_Cached_bytes{job="node-exporter", instance="192.168.64.4:9100"}
)
---
node_memory_Buffers_bytes{job="node-exporter", instance="192.168.64.4:9100"}
---
node_memory_Cached_bytes{job="node-exporter", instance="192.168.64.4:9100"}
---
node_memory_MemFree_bytes{job="node-exporter", instance="192.168.64.4:9100"}
取得されたデータは以下の通り。
| Time | memory used | memory buffers | memory cached | memory free |
|---|---|---|---|---|
| 2023-12-16 20:30:00 | 1983442944 | 63852544 | 1844629504 | 208982016 |
| 2023-12-16 21:00:00 | 1955655680 | 65232896 | 1863643136 | 216375296 |
| 2023-12-16 21:15:00 | 1988075520 | 65912832 | 1889230848 | 157687808 |
| 2023-12-16 22:15:00 | 2034294784 | 66834432 | 1908031488 | 91746304 |
それぞれ利用されているメモリ、バッファされているメモリ、キャッシュされているメモリ、空いているメモリがわかりますね。
またそれぞれByte単位表示されているので、少々見づらいですね。
こちらを変換するとおおよそ以下のようになります。
- memory used: 1.9-2.0GiB
- memory buffers: 63.8-66.8MiB
- memory cached: 1.8-1.9GiB
- memory free: 91.7-216.3MiB
今回の仮想環境では4G分メモリを割り当ていますが、利用されているメモリとキャッシュされているメモリでほぼカツカツであることが分かりますね。
ディスクI/O
続いてディスク。グラフに利用されているPromQLは以下の通り。
rate(node_disk_read_bytes_total{job="node-exporter", instance="192.168.64.4:9100", device=~"(/dev/)?(mmcblk.p.+|nvme.+|rbd.+|sd.+|vd.+|xvd.+|dm-.+|md.+|dasd.+)"}[$__rate_interval])
---
rate(node_disk_written_bytes_total{job="node-exporter", instance="192.168.64.4:9100", device=~"(/dev/)?(mmcblk.p.+|nvme.+|rbd.+|sd.+|vd.+|xvd.+|dm-.+|md.+|dasd.+)"}[$__rate_interval])
---
rate(node_disk_io_time_seconds_total{job="node-exporter", instance="192.168.64.4:9100", device=~"(/dev/)?(mmcblk.p.+|nvme.+|rbd.+|sd.+|vd.+|xvd.+|dm-.+|md.+|dasd.+)"}[$__rate_interval])
取得されたデータは以下の通り。
| Time | sda read | vda read | sda written | vda written | sda io time | vda io time |
|---|---|---|---|---|---|---|
| 2023-12-16 20:30:00 | 0 | 0 | 35999 | 0 | 0.00191 | 0 |
| 2023-12-16 21:00:00 | 182 | 0 | 33404 | 0 | 0.00213 | 0 |
| 2023-12-16 21:15:00 | 0 | 0 | 33222 | 0 | 0.00316 | 0 |
| 2023-12-16 22:15:00 | 182 | 0 | 318312 | 0 | 0.00333 | 0 |
ディスクはほぼ読み書きがなくてデータとして少しつまらないものになっていますね、すみません ![]()
sdaとvdaとはSCSIとvirtio-blkの違いのようです。基本的には物理か仮想かの違いっぽい?
ネットワークI/O
最後にネットワーク。ネットワークはNetwork ReceivedとNetwork Transmittedで受信と送信でそれぞれ分かれていました。
グラフに利用されているPromQLは以下の通り。
rate(node_network_receive_bytes_total{job="node-exporter", instance="192.168.64.4:9100", device!="lo"}[$__rate_interval]) * 8
rate(node_network_transmit_bytes_total{job="node-exporter", instance="192.168.64.4:9100", device!="lo"}[$__rate_interval]) * 8
取得されたデータは以下の通り。
(実際にはいくつかコンテナの通信と思われるvethが出てきますが、数が多すぎるので今回は省略)
- Network Received
| Time | cni0 | enp0s1 | flannel.1 |
|---|---|---|---|
| 2023-12-16 20:30:00 | 28621 | 6374 | 0 |
| 2023-12-16 21:00:00 | 28681 | 1290 | 0 |
| 2023-12-16 21:15:00 | 29407 | 2353 | 0 |
| 2023-12-16 22:15:00 | 28766 | 1949 | 0 |
- Network Transmitted
| Time | cni0 | enp0s1 | flannel.1 |
|---|---|---|---|
| 2023-12-16 20:30:00 | 187218 | 19940 | 0 |
| 2023-12-16 21:00:00 | 187337 | 685 | 0 |
| 2023-12-16 21:15:00 | 250836 | 901 | 0 |
| 2023-12-16 22:15:00 | 188907 | 1006 | 0 |
cni0とflannnel.1はflannnelの通信用ですね。k3sのclusterやPodの通信に使われるみたいです。
今回はPod間ではcni0で通信がありますが、別clusterを構築していないためflannnelでは通信がないということだと思われます。
(k8sのネットワーキングについて詳しくはこちら)
enp1s0はイーサネットの1番目のパス0番目のスロットということのようです。
こちらの値もByte/secondのようなので、値を見やすくすると以下のようになります。
- Network Received
- cni0: 28-29 kbit/s
- enp0s1: 1-6 kbit/s
- Network Transmitted
- cni0: 187-250 kbit/s
- enp0s1: 0.6-19 kbit/s
両者の結果を比較する
では、それぞれ取得した値を得たところで結果を比較してみましょう。
CPU
vmstatやdstatでは利用されているCPUの割合は1, 多くても4ということで小数点以下がなくそもそもこの値が結構アバウトで誤差があるかもですね ![]()
とはいえ、今回のサンプルで一番CPU使用率が多そうな20:30のデータでは、vmstatの値4とNode exporterのそれぞれ0.0437, 0.0438は大体一致していると言っても良いのではないでしょうか!
今後もっと負荷がかかった場合も調べられたらいいですね。
メモリ
dstatの方が値として見やすいので、こちらを参考に見ていきましょう。
今回のサンプルで一番メモリ使用率が多そうな22:15のデータを見てましょう。
表とデータをいい感じに抜き取ったり並べ替えたりすると...
vmstat
free         buff        cache
75888        65272      2081920

---
dstat
 ------memory-usage-----
| used  free  buff  cach|
|1744M 74.1M 63.7M 1820M|
| memory used | memory free | memory buffers | memory cached |
|---|---|---|---|
| 2034M | 91M | 66M | 1908M |
このような感じになりました。
こうして見てみるとバッファはそこそこ正確な値ですが、それ以外の値は結構差がありますね...
他の時間の値でも、特に「memory used」の値はNode exporterで取得した値の方が大きくなっているようです。
その他の値もNode exporterで取得した値の方が大きくなっていそうですね。
ですが、メモリの使用量の傾向としては問題なく把握できそうですね。
もしかしたら、PromQLの設定次第ではもっと正しい値(vmstat, dstatを正しいとした場合)に近くなりそうですね。
メモリの比較
| Time | memory used | memory free | memory buffers | memory cached |
|---|---|---|---|---|
| 2023-12-16 20:30:00 | 1983442944 | 208982016 | 63852544 | 1844629504 |
| 2023-12-16 21:00:00 | 1955655680 | 216375296 | 65232896 | 1863643136 |
| 2023-12-16 21:15:00 | 1988075520 | 157687808 | 65912832 | 1889230848 |
| 2023-12-16 22:15:00 | 2034294784 | 91746304 | 66834432 | 1908031488 |
------------------------memory---------------------- -----timestamp-----
        swpd         free         buff        cache                  JST
           0       197028        62372      2019592  2023-12-16 20:
           0       200832        63732      2038180  2023-12-16 21:
           0       152560        64380      2063300  2023-12-16 21:
           0        75888        65272      2081920  2023-12-16 22:15:00
------memory-usage----- -----system----
| used  free  buff  cach|     time
|1689M  192M 60.9M 1759M|16-12 20:30:00
|1666M  196M 62.2M 1778M|16-12 21:00:00
|1688M  149M 62.9M 1802M|16-12 21:15:00
|1744M 74.1M 63.7M 1820M|16-12 22:15:00
ディスク
ディスクに関しては、vmstatでもdstatでも22:15のwriteが40kがある以外0であんまり参考になりませんね ![]()
この時間のNode exporterで収集されたsda writtenを見ると、318312という値があり、ここだけ10倍高い値があってそれが反映されていそうですね。
ただ、どうしてvmstatとdstatで40kになったのだろう...(sda writtenの値から考えると300kか400kになりそうな気がしている)
原因を考えて見たところ、単純にvmstatとdstatにデータが出てくるラグかもしれません。
22:15:00から前後5秒のログを見返したところ、1秒後にそれらしきbiとwritがありました。
ubuntu@example-k8s:~$ vmstat 1 --wide --timestamp
--procs-- -----------------------memory---------------------- ---swap-- -----io---- -system-- --------cpu-------- -----timestamp-----
   r    b         swpd         free         buff        cache   si   so    bi    bo   in   cs  us  sy  id  wa  st                 JST
   0    0            0        80816        65272      2081912    0    0     0     0 1589 3082   5   1  94   0   0 2023-12-16 22:14:55
   0    0            0        80816        65272      2081912    0    0     0     0 1245 2380   2   1  97   0   0 2023-12-16 22:14:56
   0    0            0        75888        65272      2081912    0    0     0     0 2094 4193   7   2  92   0   0 2023-12-16 22:14:57
   0    0            0        75888        65272      2081912    0    0     0     0 1282 2500   1   1  98   0   0 2023-12-16 22:14:58
   0    0            0        75888        65272      2081912    0    0     0     0 1716 3426   3   1  96   0   0 2023-12-16 22:14:59
   7    0            0        75888        65272      2081920    0    0     0    40 1302 2532   1   0  98   0   0 2023-12-16 22:15:00
   0    0            0        75636        65272      2082320    0    0   488     4 1867 3802   5   4  91   0   0 2023-12-16 22:15:01
   4    0            0        75636        65272      2082416    0    0     0     0 1355 2648   1   1  98   0   0 2023-12-16 22:15:02
   0    0            0        75132        65272      2082416    0    0     0   304 1298 2540   2   0  97   0   0 2023-12-16 22:15:03
   0    0            0        74376        65272      2082416    0    0     0     0 1225 2436   1   1  98   0   0 2023-12-16 22:15:04
   1    0            0        74376        65272      2082424    0    0     0     0 1583 3106   2   1  97   0   0 2023-12-16 22:15:05
ubuntu@example-k8s:~$ dstat --cpu --mem --disk --net --time
--total-cpu-usage-- ------memory-usage----- -dsk/total- -net/total- ----system----
usr sys idl wai stl| used  free  buff  cach| read  writ| recv  send|     time
  5   1  94   0   0|1739M 78.9M 63.7M 1820M|   0     0 |  11k 9388B|16-12 22:14:55
  2   1  97   0   0|1739M 78.9M 63.7M 1820M|   0     0 |6054B 6536B|16-12 22:14:56
  7   1  92   0   0|1744M 74.1M 63.7M 1820M|   0     0 |  35k 1385k|16-12 22:14:57
  1   1  98   0   0|1744M 74.1M 63.7M 1820M|   0     0 |1181B 1661B|16-12 22:14:58
  3   1  96   0   0|1744M 74.1M 63.7M 1820M|   0     0 |  10k   66k|16-12 22:14:59
  1   1  98   0   0|1744M 74.1M 63.7M 1820M|   0    40k|3120B 3796B|16-12 22:15:00
  6   3  90   0   0|1744M 73.9M 63.7M 1820M| 488k 4096B|  20k   13k|16-12 22:15:01
  1   1  98   0   0|1743M 73.9M 63.7M 1820M|   0     0 | 132B  628B|16-12 22:15:02
  2   1  97   0   0|1744M 73.4M 63.7M 1820M|   0   304k|7662B 4546B|16-12 22:15:03
  1   1  98   0   0|1745M 72.6M 63.7M 1820M|   0     0 | 132B  620B|16-12 22:15:04
  3   1  97   0   0|1745M 72.6M 63.7M 1820M|   0     0 |  12k   37k|16-12 22:15:05
ここについては、実際にディスクのI/Oがあるシステムで再度要検証ですね!
ネットワーク
こちらについてはdstatの値で見るのが良さそうですね。
-net/total- ----system----
 recv  send|     time
3002B 3438B|16-12 20:30:00
3002B 4496B|16-12 21:00:00
8228B 5098B|16-12 21:15:00
3120B 3796B|16-12 22:15:00
- Network Received
| Time | cni0 | enp0s1 |
|---|---|---|
| 2023-12-16 20:30:00 | 28621 | 6374 |
| 2023-12-16 21:00:00 | 28681 | 1290 |
| 2023-12-16 21:15:00 | 29407 | 2353 |
| 2023-12-16 22:15:00 | 28766 | 1949 |
- Network Transmitted
| Time | cni0 | enp0s1 |
|---|---|---|
| 2023-12-16 20:30:00 | 187218 | 19940 |
| 2023-12-16 21:00:00 | 187337 | 685 |
| 2023-12-16 21:15:00 | 250836 | 901 |
| 2023-12-16 22:15:00 | 188907 | 1006 |
う〜ん、これは... ![]()
![]()
![]()
dstatだとあまりInとOutで差がなさそうなのですが、Node Exporterで取得した値だとOutの方が10倍ぐらい大きくなっているようなのですが。
ByteとBitの違いということを考慮したとしても、やはり差が大きそうな感じがありますね。
何が原因なのかは調べきれませんでしたが、今後確認していきたいですね。
まとめ
今回、Node Exporterで取得した値をkube-prometheus-stackでデフォルトで導入されているGrafanaのダッシュボードから確認したものとNode上で直接vmstatとdstatコマンドを用いて確認したものを比較してみました。
結論としては、どちらもおおよその値の動き方は同様でしたが、細かい値では差があることもありました。
こちらの原因として考えられるのは、以下の内容です。
- vmstatやdstatの表示タイミングのズレ
- 今回タイムスタンプ00秒でピッタリのところで取ってきたが、前後数秒の値がNode exporterの値かも?
- PromQLでもっと正しいクエリを見つける
- kube-prometheus-stackでデフォルトのクエリで今回調べましたが、もっと良いクエリがあるかも?
他にも原因や理由があるかもですが、今回調べられた範囲だとこのような感じでしょうか。
今後もっと実際のシステムに近いところでも値を比較していけたらと思います!
【おまけ】Apple Silicon Macにローカルk3s環境構築
今回Prometheusの環境を作成するために、kube-prometheus-stackというHelm Chartを利用しました。
こちらを利用するために、KubernetesとHelmとHelmfileを実行できる環境が必要でしたので、ローカルPC上に構築しました。
ローカルのk8s環境というと、minikubeだったり、kindが有名かなと思います。また、Docker Desktopの機能を使うのも良いと思います。ですが、今回はMultipassというものを利用して作成してみました。
以下の記事をとても参考にさせていただきました。
Multipassインストール
まずはMultipassをbrewを用いてインストールします。
(今回基本Macへのソフトウェアのインストールはbrewを使いました)
md@shinano ~ % brew --version
Homebrew 4.1.24
Homebrew/homebrew-core (git revision 8fa8a619528; last commit 2023-12-10)
md@shinano ~ % brew upgrade
==> `brew cleanup` has not been run in the last 30 days, running now...
Disable this behaviour by setting HOMEBREW_NO_INSTALL_CLEANUP.
Hide these hints with HOMEBREW_NO_ENV_HINTS (see `man brew`).
==> Downloading https://formulae.brew.sh/api/formula.jws.json
############################################################################################## 100.0%
md@shinano ~ % brew install --cask multipass
==> Downloading https://formulae.brew.sh/api/cask.jws.json
############################################################################################## 100.0%
==> Downloading https://raw.githubusercontent.com/Homebrew/homebrew-cask/f9965c0cadc974f2b8706ecab78c
############################################################################################## 100.0%
==> Downloading https://github.com/canonical/multipass/releases/download/v1.12.2/multipass-1.12.2+mac
==> Downloading from https://objects.githubusercontent.com/github-production-release-asset-2e65be/114
############################################################################################## 100.0%
==> Installing Cask multipass
==> Running installer for multipass with sudo; the password may be necessary.
Password:
installer: Package name is multipass
installer: Installing at base path /
installer: The install was successful.
🍺  multipass was successfully installed!
md@shinano multipass % multipass --version
multipass   1.12.2+mac
multipassd  1.12.2+mac
Multipassで仮想環境作成
multipass launchコマンドで環境を作成します。今回は元記事を参考にCPU数が2, メモリが4G, ストレージが50Gとしました。
md@shinano multipass % multipass launch -n example-k8s -c 2 -m 4G -d 50G --cloud-init cloud-init.yaml
Launched: example-k8s
md@shinano multipass % multipass info example-k8s
Name:           example-k8s
State:          Running
IPv4:           192.168.64.2
Release:        Ubuntu 22.04.3 LTS
Image hash:     9256911742f0 (Ubuntu 22.04 LTS)
CPU(s):         2
Load:           0.04 0.11 0.08
Disk usage:     2.0GiB out of 48.4GiB
Memory usage:   153.6MiB out of 3.8GiB
Mounts:         --
Multipassは環境作成時にcloud-initが使えますので、以下の内容を実行しました。
---
repo_update: true
repo_upgrade: true
timezone: Asia/Tokyo
locale: ja_JP.utf8

packages:
  - curl
  - unzip

runcmd:
  # k3sのインストール
  - curl -sfL https://get.k3s.io | INSTALL_K3S_EXEC="server --disable traefik" sh
ちなみに、参考にした元記事ではk3sのインストールを以下のコマンドで行っていました。
curl -sfL https://get.k3s.io | INSTALL_K3S_EXEC="server --no-deploy traefik" sh -
ですが、その状態でkubeconfigの設定を行おうとするとエラーになりました。
md@shinano multipass % chmod +x ./update-kubeconfig.sh
md@shinano multipass % ./update-kubeconfig.sh
./update-kubeconfig.sh: line 18: ${K3S_CONFIG_PATH}: ambiguous redirect
cat: /etc/rancher/k3s/k3s.yaml: No such file or directory
Multipassの仮想環境にアクセスし、k3sのserviceを確認したところ以下のようになっていました。
● k3s.service - Lightweight Kubernetes
     Loaded: loaded (/etc/systemd/system/k3s.service; enabled; vendor preset: enabled)
     Active: activating (auto-restart) (Result: exit-code) since Sun 2023-12-10 21:50:44 JST; 948ms ago
       Docs: https://k3s.io
    Process: 8961 ExecStartPre=/bin/sh -xc ! /usr/bin/systemctl is-enabled --quiet nm-cloud-setup.service (code=exited, status=0/SUCCESS)
    Process: 8963 ExecStartPre=/sbin/modprobe br_netfilter (code=exited, status=0/SUCCESS)
    Process: 8964 ExecStartPre=/sbin/modprobe overlay (code=exited, status=0/SUCCESS)
    Process: 8965 ExecStart=/usr/local/bin/k3s server --no-deploy traefik (code=exited, status=1/FAILURE)
   Main PID: 8965 (code=exited, status=1/FAILURE)
        CPU: 37ms

12月 10 21:50:44 example-k8s k3s[8965]:    --protect-kernel-defaults                  (agent/node) Kernel tuning behavior. If set, error if kernel tunables are different than kubelet defaults.
12月 10 21:50:44 example-k8s k3s[8965]:    --secrets-encryption                       Enable secret encryption at rest
12月 10 21:50:44 example-k8s k3s[8965]:    --enable-pprof                             (experimental) Enable pprof endpoint on supervisor port
12月 10 21:50:44 example-k8s k3s[8965]:    --rootless                                 (experimental) Run rootless
12月 10 21:50:44 example-k8s k3s[8965]:    --prefer-bundled-bin                       (experimental) Prefer bundled userspace binaries over host binaries
12月 10 21:50:44 example-k8s k3s[8965]:    --selinux                                  (agent/node) Enable SELinux in containerd [$K3S_SELINUX]
12月 10 21:50:44 example-k8s systemd[1]: Failed to start Lightweight Kubernetes.
12月 10 21:50:44 example-k8s k3s[8965]:    --lb-server-port value                     (agent/node) Local port for supervisor client load-balancer. If the supervisor and apiserver are not colocated an add>
12月 10 21:50:44 example-k8s k3s[8965]:
12月 10 21:50:44 example-k8s k3s[8965]: time="2023-12-10T21:50:44+09:00" level=fatal msg="flag provided but not defined: -no-deploy"
何かインストールコマンドがうまく行っていなさそう、ということが分かりましたので調べてみたところ、今回採用したインストールコマンドがGitHubのissueから見つけました。
kubeconfigの設定
mac上でkubectlを実行するためにkubeconfigの設定を行います。
事前にkubectl kubectx jqはインストールしておきましょう。
また、作成したスクリプトについて(今後も)は、chmod +x update-kubeconfig.sh でパーミッションを変えてあげましょう。
md@shinano multipass % ./update-kubeconfig.sh
Switched to context "example.local".
md@shinano multipass % kubectl get nodes
NAME          STATUS   ROLES                  AGE   VERSION
example-k8s   Ready    control-plane,master   18m   v1.28.4+k3s2
#!/bin/bash

set -eo pipefail

readonly MULTIPASS_INSTANCE_NAME="example-k8s"
readonly MULTIPASS_CONTEXT_NAME="example.local"
readonly MULTIPASS_INSTANCE_IP=$(multipass info ${MULTIPASS_INSTANCE_NAME} --format=json | jq -r ".info[\"${MULTIPASS_INSTANCE_NAME}\"].ipv4[0]")
readonly K3S_CONFIG_PATH="/Users/md/Code/multipass/k3s-config" # 好きなパスでOK、あとで消すので

# コンテキストが定義されているかどうかの確認
readonly EXISTS_CONTEXT=$(kubectl config get-contexts ${MULTIPASS_CONTEXT_NAME} > /dev/null 2>&1; echo $?)

# コンテキストが定義されていない場合
if [[ ${EXISTS_CONTEXT} -ne 0 ]]; then

  # k3sのkubeconfigファイルを取得する
  multipass exec ${MULTIPASS_INSTANCE_NAME} \
    -- sudo cat /etc/rancher/k3s/k3s.yaml \
    | sed -E "s;127.0.0.1;${MULTIPASS_INSTANCE_IP};g;s;: default;: ${MULTIPASS_CONTEXT_NAME};g" \
    > ${K3S_CONFIG_PATH}

  # kubeconfigを既存ファイルとマージする
  mkdir -p $HOME/.kube
  [[ -e $HOME/.kube/config ]] && cp -f $HOME/.kube/config $HOME/.kube/config.bak
  KUBECONFIG=$HOME/.kube/config.bak:${K3S_CONFIG_PATH} kubectl config view --flatten > $HOME/.kube/config
  chmod 0600 $HOME/.kube/config
  rm -f ${K3S_CONFIG_PATH}

fi

# コンテキストを切り替える
kubectx ${MULTIPASS_CONTEXT_NAME}
Multipass環境にMacのディレクトリをマウントする
Mac上で作成したマニフェストや設定ファイルなどをMultipass上で利用できるように、ディレクトリのマウントを行います。
md@shinano multipass % ./mount-user-dir.sh
md@shinano multipass % multipass shell example-k8s
Welcome to Ubuntu 22.04.3 LTS (GNU/Linux 5.15.0-89-generic aarch64)
・・・

ubuntu@example-k8s:~$ ll /
total 80
drwxr-xr-x  21 root   root    4096 12月 10 22:32 ./
drwxr-xr-x  21 root   root    4096 12月 10 22:32 ../
drwxr-xr-x   2 ubuntu ubuntu  4096 12月 10 22:30 Users/
lrwxrwxrwx   1 root   root       7 11月 30 17:09 bin -> usr/bin/
drwxr-xr-x   4 root   root    4096 11月 30 17:13 boot/
drwxr-xr-x  16 root   root    3700 12月 10 22:07 dev/
drwxr-xr-x  93 root   root    4096 12月 10 22:09 etc/
drwxr-xr-x   3 root   root    4096 12月 10 22:07 home/
lrwxrwxrwx   1 root   root       7 11月 30 17:09 lib -> usr/lib/
drwx------   2 root   root   16384 11月 30 17:12 lost+found/
drwxr-xr-x   1 ubuntu ubuntu   160 12月 10 22:29 macOS/
drwxr-xr-x   2 root   root    4096 11月 30 17:09 media/
drwxr-xr-x   2 root   root    4096 11月 30 17:09 mnt/
drwxr-xr-x   2 root   root    4096 11月 30 17:09 opt/
dr-xr-xr-x 174 root   root       0 12月 10 22:07 proc/
drwx------   5 root   root    4096 12月 10 22:10 root/
drwxr-xr-x  33 root   root     940 12月 10 22:32 run/
lrwxrwxrwx   1 root   root       8 11月 30 17:09 sbin -> usr/sbin/
drwxr-xr-x   8 root   root    4096 12月 10 22:30 snap/
drwxr-xr-x   2 root   root    4096 11月 30 17:09 srv/
dr-xr-xr-x  13 root   root       0 12月 10 22:07 sys/
drwxrwxrwt  11 root   root    4096 12月 10 22:30 tmp/
drwxr-xr-x  11 root   root    4096 11月 30 17:09 usr/
drwxr-xr-x  13 root   root    4096 11月 30 17:11 var/
#!/bin/bash

set -eo pipefail

readonly MULTIPASS_INSTANCE_NAME="example-k8s"

# macOSホストのディレクトリを再マウントする
multipass umount ${MULTIPASS_INSTANCE_NAME} || true
multipass mount /Users/md/Code/multipass ${MULTIPASS_INSTANCE_NAME}:/macOS
Mac上からMultipassに作成したk3s環境を操作できるか確認
Mac上のマウントしたディレクトリに適当なマニフェストを作成し、Mac上からkubectlでPodが作れるか確認してみましょう。
md@shinano multipass % kubectl apply -f nginx.yaml
deployment.apps/nginx-deployment created
service/nginx-service created
md@shinano multipass % kubectl get pods
NAME                                READY   STATUS              RESTARTS   AGE
nginx-deployment-86dcfdf4c6-hsdp7   0/1     ContainerCreating   0          7s
nginx-deployment-86dcfdf4c6-hgj6x   0/1     ContainerCreating   0          7s
md@shinano multipass % kubectl get pods
NAME                                READY   STATUS    RESTARTS   AGE
nginx-deployment-86dcfdf4c6-hsdp7   1/1     Running   0          58s
nginx-deployment-86dcfdf4c6-hgj6x   1/1     Running   0          58s
apiVersion: apps/v1
kind: Deployment
metadata:
  name: nginx-deployment
spec:
  selector:
    matchLabels:
      app: nginx
  replicas: 2
  template:
    metadata:
      labels:
        app: nginx
    spec:
      containers:
      - name: nginx
        image: nginx:1.14.2
        ports:
        - containerPort: 80
---
apiVersion: v1
kind: Service
metadata:
  name: nginx-service
  labels:
    app: nginx
spec:
  type: NodePort
  ports:
  - port: 8080
    targetPort: 80
    nodePort: 30080
    protocol: TCP
  selector:
    app: nginx
multipassはホストOSから見ていい感じにアクセスできるIPを用意してくれるので、そちらを使ってアクセスします。
IPはmultipass info (環境名)で確認できます。
md@shinano multipass % multipass info example-k8s
Name:           example-k8s
State:          Running
IPv4:           192.168.64.4
                10.42.0.0
                10.42.0.1
                100.108.243.56
Release:        Ubuntu 22.04.3 LTS
Image hash:     9256911742f0 (Ubuntu 22.04 LTS)
CPU(s):         2
Load:           0.64 0.45 0.36
Disk usage:     2.3GiB out of 48.4GiB
Memory usage:   627.8MiB out of 3.8GiB
Mounts:         /Users/md/Code/multipass => /macOS
                    UID map: 501:default
                    GID map: 20:default
IPv4に書かれたアドレス:30080にブラウザからアクセス
helmインストール
公式ドキュメントを参考にインストール&テストします。
md@shinano multipass % brew install helm
==> Downloading https://formulae.brew.sh/api/formula.jws.json
############################################################################################## 100.0%
==> Downloading https://formulae.brew.sh/api/cask.jws.json
############################################################################################## 100.0%
==> Downloading https://ghcr.io/v2/homebrew/core/helm/manifests/3.13.2
############################################################################################## 100.0%
==> Fetching helm
==> Downloading https://ghcr.io/v2/homebrew/core/helm/blobs/sha256:f6637058834daadc414801e19e5155d426
############################################################################################## 100.0%
==> Pouring helm--3.13.2.arm64_ventura.bottle.tar.gz
==> Caveats
zsh completions have been installed to:
  /opt/homebrew/share/zsh/site-functions
==> Summary
🍺  /opt/homebrew/Cellar/helm/3.13.2: 65 files, 53.7MB
==> Running `brew cleanup helm`...
Disable this behaviour by setting HOMEBREW_NO_INSTALL_CLEANUP.
Hide these hints with HOMEBREW_NO_ENV_HINTS (see `man brew`).
md@shinano multipass % helm
The Kubernetes package manager

Common actions for Helm:

- helm search:    search for charts
- helm pull:      download a chart to your local directory to view
- helm install:   upload the chart to Kubernetes
- helm list:      list releases of charts

(略)

md@shinano multipass % helm repo add bitnami https://charts.bitnami.com/bitnami
"bitnami" has been added to your repositories
md@shinano multipass % helm repo update
Hang tight while we grab the latest from your chart repositories...
...Successfully got an update from the "bitnami" chart repository
Update Complete. ⎈Happy Helming!⎈
md@shinano multipass % helm install bitnami/mysql --generate-name
NAME: mysql-1702219892
LAST DEPLOYED: Sun Dec 10 23:51:33 2023
NAMESPACE: default
STATUS: deployed
REVISION: 1
TEST SUITE: None
NOTES:
CHART NAME: mysql
CHART VERSION: 9.14.4
APP VERSION: 8.0.35

** Please be patient while the chart is being deployed **

Tip:

  Watch the deployment status using the command: kubectl get pods -w --namespace default

Services:

  echo Primary: mysql-1702219892.default.svc.cluster.local:3306

Execute the following to get the administrator credentials:

  echo Username: root
  MYSQL_ROOT_PASSWORD=$(kubectl get secret --namespace default mysql-1702219892 -o jsonpath="{.data.mysql-root-password}" | base64 -d)

To connect to your database:

  1. Run a pod that you can use as a client:

      kubectl run mysql-1702219892-client --rm --tty -i --restart='Never' --image  docker.io/bitnami/mysql:8.0.35-debian-11-r0 --namespace default --env MYSQL_ROOT_PASSWORD=$MYSQL_ROOT_PASSWORD --command -- bash

  2. To connect to primary service (read/write):

      mysql -h mysql-1702219892.default.svc.cluster.local -uroot -p"$MYSQL_ROOT_PASSWORD"
md@shinano multipass % helm list
NAME            	NAMESPACE	REVISION	UPDATED                             	STATUS  	CHART       	APP VERSION
mysql-1702219892	default  	1       	2023-12-10 23:51:33.306633 +0900 JST	deployed	mysql-9.14.4	8.0.35
md@shinano multipass % kubectl get pods
NAME                                READY   STATUS    RESTARTS   AGE
nginx-deployment-86dcfdf4c6-zp54t   1/1     Running   0          29m
nginx-deployment-86dcfdf4c6-zzng9   1/1     Running   0          29m
mysql-1702219892-0                  1/1     Running   0          42s
helmfileインストール
リポジトリのREADMEを参考にインストールします。
md@shinano multipass % brew install helmfile
==> Downloading https://formulae.brew.sh/api/formula.jws.json

==> Downloading https://formulae.brew.sh/api/cask.jws.json

==> Downloading https://ghcr.io/v2/homebrew/core/helmfile/manifests/0.159.0
############################################################################################## 100.0%
==> Fetching helmfile
==> Downloading https://ghcr.io/v2/homebrew/core/helmfile/blobs/sha256:1802fd3d09cc122ae47783f5e500e4
############################################################################################## 100.0%
==> Pouring helmfile--0.159.0.arm64_ventura.bottle.tar.gz
==> Caveats
zsh completions have been installed to:
  /opt/homebrew/share/zsh/site-functions
==> Summary
🍺  /opt/homebrew/Cellar/helmfile/0.159.0: 8 files, 90.3MB
==> Running `brew cleanup helmfile`...
Disable this behaviour by setting HOMEBREW_NO_INSTALL_CLEANUP.
Hide these hints with HOMEBREW_NO_ENV_HINTS (see `man brew`).
md@shinano multipass % helmfile version

▓▓▓ helmfile

  Version            v0.159.0
  Git Commit         "brew"
  Build Date         24 Nov 23 09:42 JST (2 weeks ago)
  Commit Date        24 Nov 23 09:42 JST (2 weeks ago)
  Dirty Build        no
  Go version         1.21.4
  Compiler           gc
  Platform           darwin/arm64
kube-prometheus-stackを動かしてみる
helmfileを用いてkube-prometheus-stackをインストールします。
prometheus-values.yamlは空ファイルでも動きました。
repositories:
- name: prometheus-community
  url: https://prometheus-community.github.io/helm-charts

releases:
- name: kube-prometheus-stack
  namespace: prometheus
  createNamespace: true
  chart: prometheus-community/kube-prometheus-stack
  version: 50.3.1
  values:
  - prometheus-values.yaml
(helmfile自体の内容は、最近参加させていただいた『一日で学ぶクラウドネイティブ技術実践ハンズオン』by CloudNative Days Tokyo 2023 実行委員会で用いられたものを参考にさせていただきました。ちなみに、kube-prometheus-stack自体もこちらのハンズオンで知りました。)
helmfile syncでインストールします。
md@shinano multipass % helmfile sync -f helm/helmfile.yaml
Adding repo prometheus-community https://prometheus-community.github.io/helm-charts
"prometheus-community" has been added to your repositories

Upgrading release=kube-prometheus-stack, chart=prometheus-community/kube-prometheus-stack
Release "kube-prometheus-stack" does not exist. Installing it now.
NAME: kube-prometheus-stack
LAST DEPLOYED: Mon Dec 11 00:06:47 2023
NAMESPACE: prometheus
STATUS: deployed
REVISION: 1
NOTES:
kube-prometheus-stack has been installed. Check its status by running:
  kubectl --namespace prometheus get pods -l "release=kube-prometheus-stack"

Visit https://github.com/prometheus-operator/kube-prometheus for instructions on how to create & configure Alertmanager and Prometheus instances using the Operator.

Listing releases matching ^kube-prometheus-stack$
kube-prometheus-stack	prometheus	1       	2023-12-11 00:06:47.632757 +0900 JST	deployed	kube-prometheus-stack-50.3.1	v0.67.1


UPDATED RELEASES:
NAME                    CHART                                        VERSION   DURATION
kube-prometheus-stack   prometheus-community/kube-prometheus-stack   50.3.1         16s

md@shinano multipass %
md@shinano multipass % kubectl get pod -n prometheus
NAME                                                        READY   STATUS              RESTARTS   AGE
kube-prometheus-stack-grafana-5fbb96dc89-f5dbm              0/3     ContainerCreating   0          78s
kube-prometheus-stack-operator-7996cc94d6-mp6bv             1/1     Running             0          78s
kube-prometheus-stack-prometheus-node-exporter-8ftds        1/1     Running             0          78s
prometheus-kube-prometheus-stack-prometheus-0               0/2     PodInitializing     0          73s
kube-prometheus-stack-kube-state-metrics-7d87458f89-gq66j   1/1     Running             0          78s
alertmanager-kube-prometheus-stack-alertmanager-0           2/2     Running             0          74s
PrometheusとGrafanaにWebブラウザからアクセス
ポートフォワードを用いて、アクセスしてみましょう。
(ポートフォワードを用いてアクセスについては、以下の記事から参考にさせていただきました。)
md@shinano multipass % kubectl port-forward svc/kube-prometheus-stack-prometheus -n prometheus 9090:9090
Forwarding from 127.0.0.1:9090 -> 9090
Forwarding from [::1]:9090 -> 9090
Handling connection for 9090
localhost:9090にアクセス
md@shinano multipass % kubectl port-forward svc/kube-prometheus-stack-grafana  -n prometheus 3000:80
Forwarding from 127.0.0.1:3000 -> 3000
Forwarding from [::1]:3000 -> 3000
Handling connection for 3000
localhost:3000にアクセス
できました! ![]()
その他、以下の記事でもMultipass+k3sでとっても簡単にk8s環境が試せるんだよっていうことがわかリます。
おわりに
Prometheus Operatorなど、kube-prometheus-stackで用いられている技術を全て理解できているわけではなく、これからまだまだ勉強が必要だと感じています。実際のシステムでも問題なく利用できるように、今後も積極的にPrometheusを触っていこうと思います!
この記事は 富士通クラウドテクノロジーズ Advent Calendar 2023 の 17 日目の記事でした。
明日は@aokumaさんの「Kubernetesとニフクラでなにか」という内容の予定です。
Kubernetesは自分も最近勉強中なのでどんなことを記事にしてくれるか楽しみですね!