はじめに
データ点をSigmoid関数でフィットした結果をエラー付きで表示したいと思い、やってみました。
なお、エラーの計算は地道に手で微分して実装しています。微分や誤差の計算ツールを紹介するような記事ではないので、ご了承ください。
Sigmoid関数は、Wikipediaなどに記載されているように
f(x) = \frac{1}{1+e^{-ax}}
という関数です。このままだと味気ないので、下のように
f(x) = \frac{p_{0}}{1+e^{-p_{2
}(x - p_{1})}}
3つのパラメータ($ p_{0}, p_{1}, p_{2}$)をもつ関数をフィットに使いたいと思います。
ここでやりたいことは、以下の3つになります。
- データ点に対して関数をフィットし、パラメータを決める
- フィット時のパラメータの共分散を誤差伝搬して、関数のエラーを求める
- グラフとして表示する
環境
実行した環境は以下の通り。
$sw_vers
ProductName:    Mac OS X
ProductVersion: 10.13.6
BuildVersion:   17G14042
Jupyter Notebookを使用しました。
The version of the notebook server is: 5.7.8
The server is running on this version of Python:
Python 3.7.3 (default, Mar 27 2019, 16:54:48)
[Clang 4.0.1 (tags/RELEASE_401/final)]
やったこと
準備
フィットにはscipy.optimize.curve_fitを使用します。
他にも必要なライブラリをインポートしておきます。
from scipy.optimize import curve_fit
import numpy as np
import matplotlib.pyplot as plt
フィット用のクラスを用意しました。
fitでSigmoid関数でデータ点をフィットしています。func_sigmoid_errorでSigmoid関数のエラーを計算していますが、詳しいことは後述します。
class Fitter:
    nparams = 3
    isFitted = False

    par = {}
    cov = np.zeros((nparams,nparams))
    err = np.zeros(nparams)

    def __init__(self):
        self.isFitted = False
        for i in range(self.nparams):
            self.par['p'+str(i)] = 0

    # フィットに使用する関数
    def sigmoid(self, x, a):
        return 1.0 / (1.0 + np.exp(-a * x))

    def func_sigmoid(self, x, a, b, c):
        return a * self.sigmoid(x-b, c)

    # フィット実行
    def fit(self, xdata, ydata, p0=None, sigma=None, bounds=None):
        par, self.cov = curve_fit(f=self.func_sigmoid, xdata=xdata, ydata=ydata, p0=p0, sigma=sigma, bounds=bounds)
        for i in range(self.nparams):
            self.par['p'+str(i)] = par[i]
        self.err = np.sqrt(np.diag(self.cov))
        self.isFitted = True

        print("params: ", self.par)
        print("cov. m: ", self.cov)
        print("error : ", self.err)


    # Sigmoidの微分
    def dfdp0(self, x):
        return (self.func_sigmoid_fitted(x) / self.par['p0'])

    def dfdp1(self, x):
        return (self.func_sigmoid_fitted(x) * (self.par['p0'] - self.func_sigmoid_fitted(x)) /
                (self.par['p0'] * self.par['p1']) *
                np.log( (self.par['p0'] - self.func_sigmoid_fitted(x)) / self.func_sigmoid_fitted(x)))

    def dfdp2(self, x):
        return (self.func_sigmoid_fitted(x) *
                (self.par['p0'] - self.func_sigmoid_fitted(x)) *
                self.par['p1'] /
                self.par['p0'])

    # フィット後の関数
    def func_sigmoid_fitted(self, x):
        if not self.isFitted:
            return 0
        return self.func_sigmoid(x, *self.par.values())

    # フィット後の関数のエラー
    def func_sigmoid_error(self, x):
        if not self.isFitted:
            return 0

        # (df/dp0)^2 * dp0^2
        df2 =  np.power(self.dfdp0(x), 2) * self.cov[0][0]

        # (df/dp1)^2 * dp1^2
        df2 += np.power(self.dfdp1(x), 2) * self.cov[1][1]

        # (df/dp2)^2 * dp2^2
        df2 += np.power(self.dfdp2(x), 2) * self.cov[2][2]

        # 2 * df/dp0 * df/dp1 * (dp0dp1)^2
        df2 += 2.0 * self.dfdp0(x) * self.dfdp1(x) * self.cov[0][1]

        # 2 * df/dp1 * df/dp2 * (dp1dp2)^2
        df2 += 2.0 * self.dfdp1(x) * self.dfdp2(x) * self.cov[1][2]

        # 2 * df/dp0 * df/dp2 * (dp0dp2)^2
        df2 += 2.0 * self.dfdp0(x) * self.dfdp2(x) * self.cov[0][2]

        return np.sqrt(df2)

    def func_sigmoid_error_noCov(self, x):
        if not self.isFitted:
            return 0

        # (df/dp0)^2 * dp0^2
        df2 =  np.power(self.dfdp0(x), 2) * np.power(self.cov[0][0], 2)

        # (df/dp1)^2 * dp1^2
        df2 += np.power(self.dfdp1(x), 2) * np.power(self.cov[1][1], 2)

        # (df/dp2)^2 * dp2^2
        df2 += np.power(self.dfdp2(x), 2) * np.power(self.cov[2][2], 2)

        return np.sqrt(df2)
データをテキトーに生成するための関数を用意しておきます。上記のSigmoid関数のパラメータがそれぞれ
\begin{align}
p_{0} &= 30 \\
p_{1} &= 0.4 \\
p_{2} &= 15
\end{align}
ということを想定しており、その上で乱数でデータ点をばらつかせています。
# yのデータ生成用の関数
def ans_y(x):
    ey = np.random.normal(size=len(x))
    y = 30.0/ (1.0 + np.exp((x-15)*(-0.4)))
    return y + y * 0.1 *ey
データ生成
簡単ですが、データを作成しておきます。
# データ準備
x = np.linspace(0, 19, 20)
y = ans_y(x)
データ点を散布図として図示すると下図のようになります。
plt.plot(x, y, 'o')
plt.show()
フィット実行
さっそくフィットを実行します。初期パラメータp0とパラメータ境界boundsを定義して渡しておきます。パラメータ境界については、全パラメータが0以上の値を取るとしています。
# sigmaパラメータなし
fitter = Fitter()

p0 =[1., 1., 1.]
bounds = ((0.0, 0.0, 0.0), (np.inf, np.inf, np.inf))

fitter.fit(xdata=x, ydata=y, p0=p0, bounds=bounds)
params:  {'p0': 24.313812849093022, 'p1': 13.4398153673723, 'p2': 0.5288927431932293}
cov. m:  [[ 0.73058063  0.15976218 -0.02689416]
 [ 0.15976218  0.0458503  -0.00592103]
 [-0.02689416 -0.00592103  0.00168229]]
error :  [0.8547401  0.21412682 0.04101571]
誤差伝搬
上記のフィットで3つのパラメータの値と、共分散が求められたので、関数のエラーを計算します。
3つのパラメータがあるので、関数$f$の誤差$\Delta f$は次のような形で表せます。
\begin{align}
(\Delta f)^{2} &=
\Bigl(\frac{\partial f}{\partial p_{0}}\Bigr)^{2} (\Delta p_{0})^{2} +
\Bigl(\frac{\partial f}{\partial p_{1}}\Bigr)^{2} (\Delta p_{1})^{2} +
\Bigl(\frac{\partial f}{\partial p_{2}}\Bigr)^{2} (\Delta p_{2})^{2} +
2 \frac{\partial f}{\partial p_{0}} \frac{\partial f}{\partial p_{1}} \Delta p_{0} \Delta p_{1} +
2 \frac{\partial f}{\partial p_{0}} \frac{\partial f}{\partial p_{2}} \Delta p_{0} \Delta p_{2} +
2 \frac{\partial f}{\partial p_{1}} \frac{\partial f}{\partial p_{2}} \Delta p_{1} \Delta p_{2} \\
&=
\Bigl(\frac{\partial f}{\partial p_{0}}\Bigr)^{2} \sigma_{p_{0}p_{0}}^{2} +
\Bigl(\frac{\partial f}{\partial p_{1}}\Bigr)^{2} \sigma_{p_{1}p_{1}}^{2} +
\Bigl(\frac{\partial f}{\partial p_{2}}\Bigr)^{2} \sigma_{p_{2}p_{2}}^{2} +
2 \frac{\partial f}{\partial p_{0}} \frac{\partial f}{\partial p_{1}} \sigma_{p_{0}p_{1}}^{2} +
2 \frac{\partial f}{\partial p_{0}} \frac{\partial f}{\partial p_{2}} \sigma_{p_{0}p_{2}}^{2} +
2 \frac{\partial f}{\partial p_{1}} \frac{\partial f}{\partial p_{2}} \sigma_{p_{1}p_{2}}^{2}
\end{align}
ここで、$\sigma^{2}$は共分散、各パラメータについての偏微分については下のように計算しておき、上の式に代入すれば、関数$f$の誤差を求めることができます。
(微分など間違っていたら教えてください)
\begin{align}
\frac{\partial f}{\partial p_{0}} &= \frac{1}{1 + e^{-p_{2}(x-p_{1})}} = \frac{f}{p_{0}} \\

\frac{\partial f}{\partial p_{1}} &= \frac{p_{0}}{1+e^{-p_{2}(x-p_{1})}} e^{-p_{2}(x-p_{1})} p_{2} = \frac{f(p_{0} - f)p_{2}}{p_{0}} \\

\frac{\partial f}{\partial p_{2}} &= \frac{p_{0}}{1+e^{-p_{2}(x-p_{1})}} e^{-p_{2}(x-p_{1})} (-(x - p_{1})) = \frac{f(p_{0} - f)}{p_{0} p_{2}} \log (\frac{a-f}{f})
\end{align}
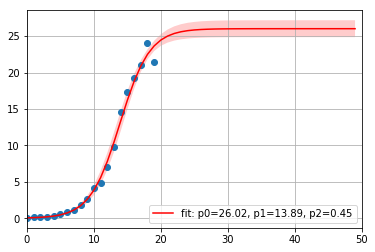
フィット後の関数と、関数のエラーを図示すると下図のようになります。
# sigmaパラメータなし & 共分散あり
pseudox = np.linspace(0, 49, 50)

res = fitter.func_sigmoid_fitted(pseudox)
err = fitter.func_sigmoid_error(pseudox)

plt.plot(x, y, 'o')
plt.plot(pseudox, res, 'r-',label='fit: p0=%.2f, p1=%.2f, p2=%.2f' % tuple(fitter.par.values()))
plt.fill_between(pseudox, res - err, res + err, facecolor='r', alpha=0.2)
plt.legend()
plt.xlim(0, 50)
plt.grid()
plt.show()
curve_fitのsigmaパラメータ
公式ドキュメントによると、sigmaパラメータはデータの$y$方向の誤差(あるいは不定性)を表すパラメータで、が1次元の場合、curve_fit の内部でフィット時の$\chi^{2}$を
\chi^{2} = \sum \Bigl( \frac{y_{obs} - f(x)}{sigma} \Bigr)^{2}
このような形で求めているとのこと。デフォルトだと$sigma = 1$として計算されるので、各データの$y$方向に誤差がある場合はsigmaパラメータに値を渡しておかないと、正しいフィット結果を得られないです。
ここでは仮に$y$方向の不定性が$\sqrt(y)$程度あるとしてsigmaパラメータに渡してフィットしてみます。
# sigmaパラメータあり
fitter = Fitter()

p0 =[1., 1., 1.]
bounds = ((0.0, 0.0, 0.0), (np.inf, np.inf, np.inf))
sigma = np.sqrt(y)

fitter.fit(xdata=x, ydata=y, p0=p0, sigma=sigma, bounds=bounds)
params:  {'p0': 26.023718633299193, 'p1': 13.885172632785503, 'p2': 0.4506783056435821}
cov. m:  [[ 1.34791009e+00  2.89911256e-01 -1.58552587e-02]
 [ 2.89911256e-01  7.53469527e-02 -4.30194913e-03]
 [-1.58552587e-02 -4.30194913e-03  3.70846221e-04]]
error :  [1.1609953  0.27449399 0.01925737]
# sigmaパラメータあり & 共分散あり
res = fitter.func_sigmoid_fitted(pseudox)
err = fitter.func_sigmoid_error(pseudox)

plt.plot(x, y, 'o')
plt.plot(pseudox, res, 'r-',label='fit: p0=%.2f, p1=%.2f, p2=%.2f' % tuple(fitter.par.values()))
plt.fill_between(pseudox, res - err, res + err, facecolor='r', alpha=0.2)
plt.legend()
plt.xlim(0, 50)
plt.grid()
plt.show()
多少フィット結果とエラーが変わっている感じがします。
共分散の非対角成分を考慮しない場合
共分散の非対角成分が小さい値の場合は
(\Delta f)^{2}
\sim
\Bigl(\frac{\partial f}{\partial p_{0}}\Bigr)^{2} \sigma_{p_{0}p_{0}}^{2} +
\Bigl(\frac{\partial f}{\partial p_{1}}\Bigr)^{2} \sigma_{p_{1}p_{1}}^{2} +
\Bigl(\frac{\partial f}{\partial p_{2}}\Bigr)^{2} \sigma_{p_{2}p_{2}}^{2}
と表せるので、試しにこの場合どうなるのか計算してみます。
# sigmaパラメータあり & 共分散なし

res = fitter.func_sigmoid_fitted(pseudox)
err = fitter.func_sigmoid_error_noCov(pseudox)

plt.plot(x, y, 'o')
plt.plot(pseudox, res, 'r-',label='fit: p0=%.2f, p1=%.2f, p2=%.2f' % tuple(fitter.par.values()))
plt.fill_between(pseudox, res - err, res + err, facecolor='r', alpha=0.2)
plt.legend()
plt.xlim(0, 50)
plt.grid()
plt.show()
この場合は誤差が若干大きく見積もられてしまっています。
まとめ
データ点をSigmoid関数でフィットした結果をエラー付きで表示してみました。
ちょっと偏微分と誤差伝搬は自信ないですが、間違いがあれば教えてください。


