1.はじめに
Fluentdでルーターから転送速度を計算して、Kibanaで可視化するまで苦労したことの備忘録
特にFluentdで苦労した部分多目。
何か不備などあればコメント大歓迎。
とりあえずおさらいとして…
・Fluentd…ログを整形して指定先のサーバーに転送してくれる凄いやつ。
・Elasticsearch…全文検索エンジン。分散型データベースでJSON形式とかで格納出来る凄いやつ。
・Kibana…Elasticsearchを主軸にクエリ検索してグラフ化とかしてくれる凄いやつ。
↓玄人はこんなことできるそうな
いずれもインストール済みであることを前提に進める。
2.環境
Router:RTX830 IP:192.168.1.1
Server:CentOS7 IP:192.168.1.2
Installed:Elasticsearch 6.6.2/Kibana 6.7.0/td-agent3
3.SNMP取得
YAMAHAルーター設定
Fluentdでルーターの情報を取得するには、SNMP v1とSNMP v2を有効にする必要があります。
事前にルーター側で以下のコマンドを実行して設定します。
これだけ!簡単!
snmp host 192.168.1.2 public
snmpv2c host 192.168.1.2
CentOS設定
Fluentdを利用してSNMPの情報を取得するにはfluent-plugin-snmpが必要になるので、以下コマンドでプラグインをインストール。
$ ./fluent-gem install fluent-plugin-snmp
FluentdからSNMPでルーターの情報取得して、それを出力するためのConfigを設定。
取得するMIBはインターフェース名、受信総転送量、送信総転送量。
<source>
  type snmp
  tag local.in
  host 192.168.1.1  //ルーターのIPアドレス
  community public  //SNMPコミュニティ名
  mib ifDescr, ifInOctets, ifOutOctets //取得するMIB名
  method_type walk
  polling_time 10 //取得する秒間隔
  polling_type async_run
  out_executor /path/out_exec.rb
</source>

<match *.*>
  type stdout
</match>
各インターフェースごとにまとめて整形したデータで出力したいのでout_executorを用います。
FluentdはRubyで作成されているため、用いられるプラグインもRuby仕様のソースコードになります。
いや、Rubyとか使ったことないんだけど…こんなんでいいのか…?自信はありません(笑)
もっと良い書き方あったら教えてください。
【余談】
YAMAHAルーターだけかわかりませんが、インターフェース名によっては[1],[2],…と[]が付与されており、これがKibanaで可視化する際に邪魔なのでこの時点で[]を消す処理を記載しています。
※Tunnel[1]とかね
module Fluent
  class SnmpInput
    def out_exec manager, opts={}
      manager.walk(opts[:mib]) do |row|
        time = Time.now.to_i
        time = time - time  % 5
        record = {}
        data = {}
        row.each do |vb|
          data["name"] = vb.value.to_s if vb.name.to_s =~ /Descr/
          data["InOctets"] = vb.value.to_i if vb.name.to_s =~ /InOctets/
          data["OutOctets"] = vb.value.to_i if vb.name.to_s =~ /OutOctets/
        end
        if data.has_key?("name")
          data["name"] = data["name"].delete("[")
          data["name"] = data["name"].delete("]")
          record["Interface"] = data["name"] if data.has_key?("name")
          record["InOctets"] = data["InOctets"] if data.has_key?("InOctets")
          record["OutOctets"] = data["OutOctets"] if data.has_key?("OutOctets")
        end
        if record
          router.emit opts[:tag], time, record
        end
      end
    end
  end
end
fluentdを実行した結果は以下の通り。
2019-04-07 12:00:50.000000000 +0900 local.in: {"Interface":"LAN1","InOctets":208651,"OutOctets":167928}
2019-04-07 12:00:50.000000000 +0900 local.in: {"Interface":"LAN2","InOctets":205412,"OutOctets":149282}
2019-04-07 12:00:50.000000000 +0900 local.in: {"Interface":"TUNNEL1","InOctets":19287,"OutOctets":17829}
4.総転送量から転送速度を計算
本記事では総転送量から転送速度を計算しています。
計算方法としては以下のように算出することで計算できると認識してます。
転送速度=(送受信転送量ー前回取得時の送受信転送量)/取得秒数間隔
Fluentdでは上記を計算してくれるfluent-plugin-deriveという凄いプラグインが存在するので、これを利用します。
また、ホスト名を某事情で別途追加したかったのでfluent-plugin-record-reformerという便利なプラグインも同時にインストール。
$ ./fluent-gem install fluent-plugin-snmp
$ ./fluent-gem install fluent-plugin-record-reformer
それに応じてFluentdのConfigも変更して計算できるように設定します。
今回、取得している転送量はビット数なので、ここから8を乗算し、bps→byte/secに計算して出力していきます。
<source>
  type snmp
  tag local.in
  host 192.168.1.1
  community public
  mib ifDescr, ifInOctets, ifOutOctets
  method_type walk
  polling_time 10
  polling_type async_run
  out_executor /path/out_exec.rb
</source>

<filter *.in>
  type grep
  exclude1 InOctets ^0$
</filter>

<match local.*>
  type record_reformer
  tag RTX830.local
  <record>
    hostname RTX830_local
  </record>
</match>

<match RTX830.*>
  type copy
  <store>
    type derive
    add_tag_prefix derive
    key2 InOctets *8 //byte/sec形式に計算
    key3 OutOctets *8 //byte/sec形式に計算
  </store>
  <store>
    type stdout
  </store>
</match>
いざ、実行してみると、なにやらたくさんの警告文…
それにうまくいってないっぽい…
2019-04-07 14:10:55.000000000 +0900 RTX830.local: {"Interface":"LAN1","InOctets":null,"OutOctets":null,"hostname":"RTX830_local"}
2019-04-07 14:10:55 +0900 [warn]: #0 Could not calculate the rate. multiple input less than one second or minus delta of seconds on tag=RTX830.local, key=InOctets
2019-04-07 14:10:55 +0900 [warn]: #0 Could not calculate the rate. multiple input less than one second or minus delta of seconds on tag=RTX830.local, key=OutOctets
2019-04-07 14:10:55 +0900 [warn]: #0 BUG: use router.emit instead of Engine.emit
2019-04-07 14:10:55.000000000 +0900 RTX830.local: {"Interface":"LAN2","InOctets":nil,"OutOctets":nil,"hostname":"RTX830_local"}
・・・(省略)・・・
2019-04-07 14:10:55.000000000 +0900 RTX830.local:{"Interface":"TUNNEL1","InOctets":nil,"OutOctets":nil,"hostname":"RTX830_local"}
とりあえず一つずつ解消していく。まず、こいつ。
2019-04-07 14:10:55 +0900 [warn]: #0 BUG: use router.emit instead of Engine.emit
Fluentd v0.12でのFilterとLabel
Use router instead of Engine.emit
どうやらfluent-plugin-deriveは長年更新されておらず、最新のFluentdに対応してないみたい。
ということで、プラグインが対応できるように修正。
修正は以下の通り、「Fluent::Engine.emit」を「router.emit」に変更するだけ。
※2箇所あるので注意
#Fluent::Engine.emit(emit_tag, time, record)
router.emit(emit_tag, time, record)
続いてこいつ。
2019-04-07 14:10:55 +0900 [warn]: #0 Could not calculate the rate. multiple input less than one second or minus delta of seconds on tag=RTX830.local, key=InOctets
2019-04-07 14:10:55 +0900 [warn]: #0 Could not calculate the rate. multiple input less than one second or minus delta of seconds on tag=RTX830.local, key=OutOctets
こいつを吐き出してるソース部分が、先ほど修正したファイル内に存在したので見てみると、どうも比べる前回の取得時間との間隔が0以下だと吐き出すみたい。ここでつまづいた…。
def calc_rate(tag, key, cur_value, prev_value, cur_time, prev_time, adjustment = nil)
    if cur_time - prev_time <= 0
      log.warn "Could not calculate the rate. multiple input less than one second or minus delta of seconds on tag=#{tag}, key=#{key}"
      return nil
結果からいうとFluentdが出力するタグ名を主キーとして計算しているため、各インターフェースを一つのインターフェースとして見ていたことが原因だった。
要はLAN1→LAN2の差分計算、LAN2→TUNNEL1の差分計算とかいう意味分からない計算していたから。そりゃこける。
てことでインターフェース名ごとにタグ名を改名してやらないといけないことがわかったので、
fluent-plugin-rewrite-tag-filterというプラグインで解決することに。
$ ./fluent-gem install fluent-plugin-rewrite-tag-filter
最終的に以下のようなConfigファイルで解決することが出来ました。
Elasticsearchへの転送も忘れずに記入。
<source>
  type snmp
  tag local.in
  host 192.168.1.1
  community public
  mib ifDescr, ifInOctets, ifOutOctets
  method_type walk
  polling_time 10
  polling_type async_run
  out_executor /path/out_exec.rb
</source>

<filter *.in>
  type grep
  exclude1 InOctets ^0$
</filter>

<match local.*>
  type record_reformer
  tag RTX830.local
  <record>
    hostname RTX830_local
  </record>
</match>

<match RTX830.*>
  type rewrite_tag_filter
  <rule>
     key Interface   //抜き取るキー名
     pattern /(.+)/  //値の抜き取り方。今回は特に指定せず、全て。
     tag $1.${tag}  //タグ名の先頭に値を付与する。
  </rule>
</match>

<match *.RTX830.*>
  type copy
  <store>
    type derive
    add_tag_prefix derive
    key2 InOctets *8
    key3 OutOctets *8
  </store>
  <store>
    type stdout
  </store>
  <store>
    type elasticsearch
    include_tag_key true
    tag_key _tag
    host 192.168.1.2    //転送先のIPアドレス
    port 9200           //Elasticsearchのポート番号。Firewall-cmdで穴あけを忘れずに。
    index_name traffic
    logstash_format true
    logstash_prefix rtx830_log
  </store>
</match>
出力される結果としては、以下の通り。
何やら警告文出てるけど、計算結果的にはうまくいってるっぽいので、気にしない(笑)
2019-04-07 15:08:50.000000000 +0900 LAN1.RTX830.local: {"Interface":"LAN1","InOctets":null,"OutOctets":null,"hostname":"RTX830_local"}
2019-04-07 15:08:51 +0900 [warn]: #0 no patterns matched tag="derive.LAN2.RTX830.local"
2019-04-07 15:08:50.000000000 +0900 LAN2.RTX830.local: {"Interface":"LAN2","InOctets":null,"OutOctets":null,"hostname":"RTX830_local"}
2019-04-07 15:08:50.000000000 +0900 TUNNEL1.RTX830.local: {"Interface":"TUNNEL1","InOctets":null,"OutOctets":null,"hostname":"RTX830_local"}
2019-04-07 15:09:01 +0900 [warn]: #0 no patterns matched tag="derive.LAN1.RTX830.local"
2019-04-07 15:09:00.000000000 +0900 LAN1.RTX830.local: {"Interface":"LAN1","InOctets":22888,"OutOctets":15584,"hostname":"RTX830_local"}
2019-04-07 15:09:00.000000000 +0900 LAN2.RTX830.local: {"Interface":"LAN2","InOctets":13192,"OutOctets":21008,"hostname":"RTX830_local"}
2019-04-07 15:09:00.000000000 +0900 TUNNEL1.RTX830.local: {"Interface":"TUNNEL1","InOctets":6480,"OutOctets":5872,"hostname":"RTX830_local"}
どうしても計算上、最初に取得される値が"null"になってしまいます。
差分するための前回データがないので当然ですね。
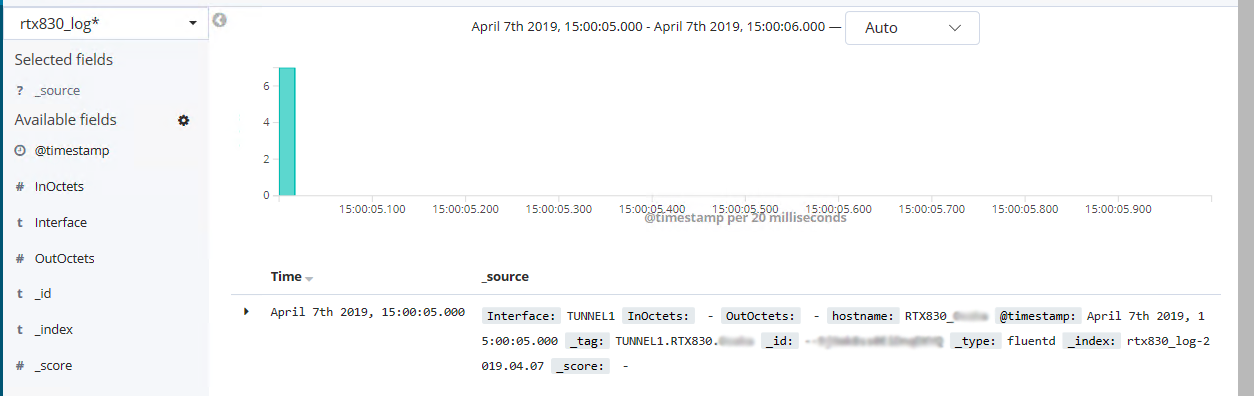
Elasticsearch側では既にlong型として登録されるようにマッピングしているので、この部分が登録されるか心配でしたが、Kibanaで確認して見たところ無事登録されているっぽい。
あとはTimelionで可視化して〜♪
.es(index=rtx830_log*, metric=max:InOctets, q='Interface:LAN1 AND hostname:RTX830_local').yaxis(units=bytes).lines(fill=1,width=0.5).label(InOctets),
.es(index=rtx830_log*, metric=max:OutOctets, q='Interface:LAN1 AND hostname:RTX830_local').yaxis(units=bytes).multiply(-1).lines(fill=1,width=0.5).label(OutOctets).title(LAN1)
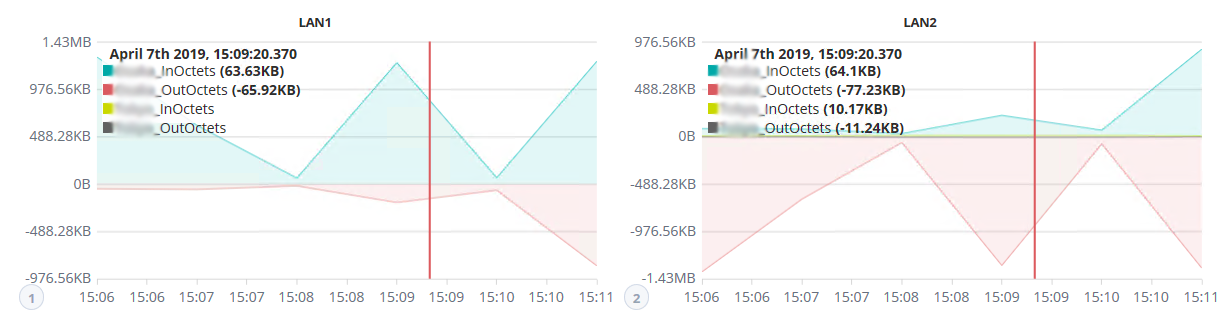
上下に見えるのかっこいいし、この瞬間が達成感あるね。
正直、時系列でグラフ化するならVisualizeよりTimelionだと思ってる。
5.まとめ
SNMPだけでもここまで出来る。
SNMPで出力出来る内容によってはより幅広くいろんなことに使えると思いますので、同じようなことで苦労している人の助けになれば幸いです。
Cisco製ルーターとかNetflowに対応しているルーターだとこんな苦労せずに更にもっといろんなことできるんだろうなぁ…。