開発環境
- python==3.7.9
- pandas==1.1.4
- matplotlib==3.3.3
- numpy==1.19.2
概説
こちらのサイトから株価のデータをダウンロードしました。
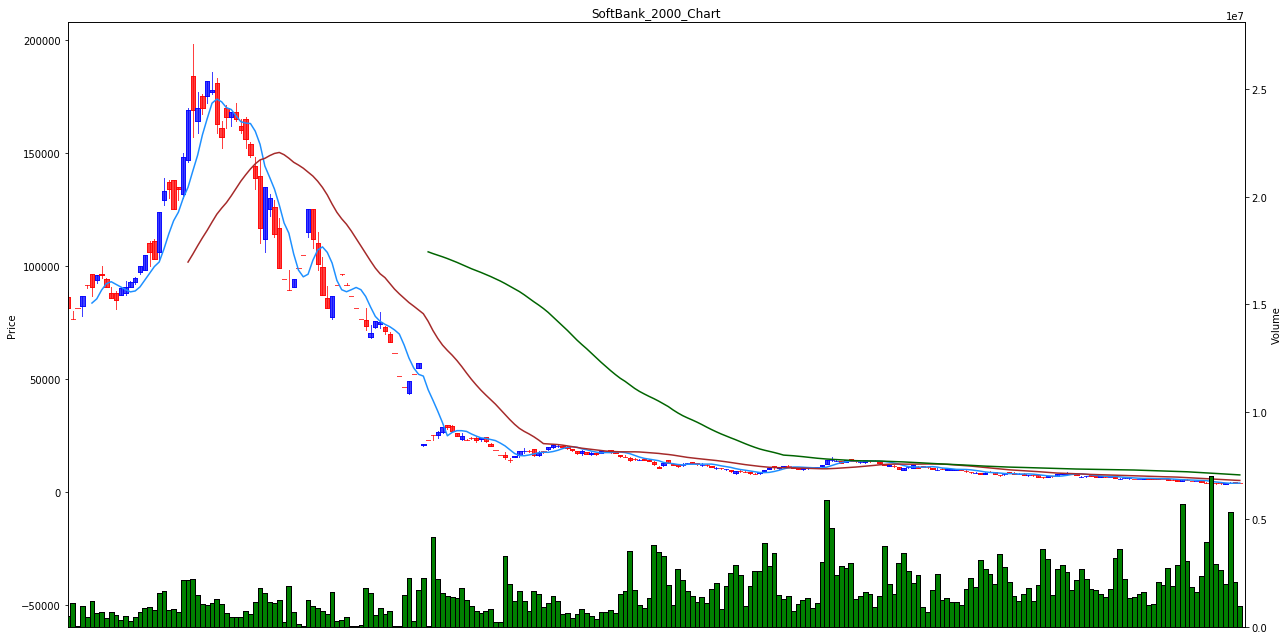
今回はソフトバンクを使用しました。使用期間は、1998年~2019年です。
- prg
    - main.py
- Graph
    - 9984_1998.png
    ・・
    ・・
    - 9984_2018.png
- csv
    - 9984_1998.csv
        ・・
    ・・
    - 9984_2018.csv
ソースコード
main.py
import pandas as pd
import matplotlib.pyplot as plt
from mpl_finance import candlestick2_ohlc,volume_overlay
import numpy as np

def SMA(signal):#移動平均線
    k = 0
    SMA = []
    for rp in range(signal):
        SMA.append(0)
    while True:
        sma = []
        for r in range(signal):
            s = df.loc[k+r,4]
            sma.append(s)
        sma5 = sum(sma)/len(sma)
        k += 1
        if k == len(df)-(signal-1):
            break
        SMA.append(sma5)
    return SMA

f = 1998
for f in range(1998,2020,1):
    df = pd.read_csv('../csv/9984_'+str(f)+'.csv',header=None)
    df['SMA5'] = SMA(5)
    df['SMA25'] = SMA(25)
    df['SMA75'] = SMA(75)
    df = df.replace(0, np.nan)

    plt.rcParams['figure.figsize'] = 30,7
    fig = plt.figure(figsize=(18, 9))
    ax = plt.subplot(1, 1, 1)
    candlestick2_ohlc(ax, df[1],df[2],df[3],df[4],width=0.9,colorup="b",colordown="r")
    plt.tick_params(labelbottom = False,bottom = False)
    plt.title('SoftBank_'+str(f)+'_Chart')
    plt.plot(df['SMA5'],label = 'SMA5',color = 'dodgerblue')
    plt.plot(df['SMA25'],label = 'SMA25',color = 'brown')
    plt.plot(df['SMA75'],label = 'SMA75',color = 'darkgreen')
    ax.set_xlim([0, df.shape[0]])
    ax.set_ylabel("Price")
    bottom,top = ax.get_ylim()
    ax.set_ylim(bottom-(top-bottom)/4,top)
    ax2 = ax.twinx()
    volume_overlay(ax2,df[1], df[6], df[5], width=1, colorup="g", colordown="g")
    ax2.set_xlim([0, df.shape[0]])
    ax2.set_ylim([0,df[5].max()*4])
    ax2.set_ylabel("Volume")
    plt.tight_layout()
    plt.savefig('..//Graph//9984_'+str(f)+'.png')
    plt.close()
画像は、以下のような感じになります。
出力結果