はじめに
仕事で React Native を使って開発をしており、知見が溜まってきたのですが、記事に起こそうと悩んでる間にかなり経ってしましました。
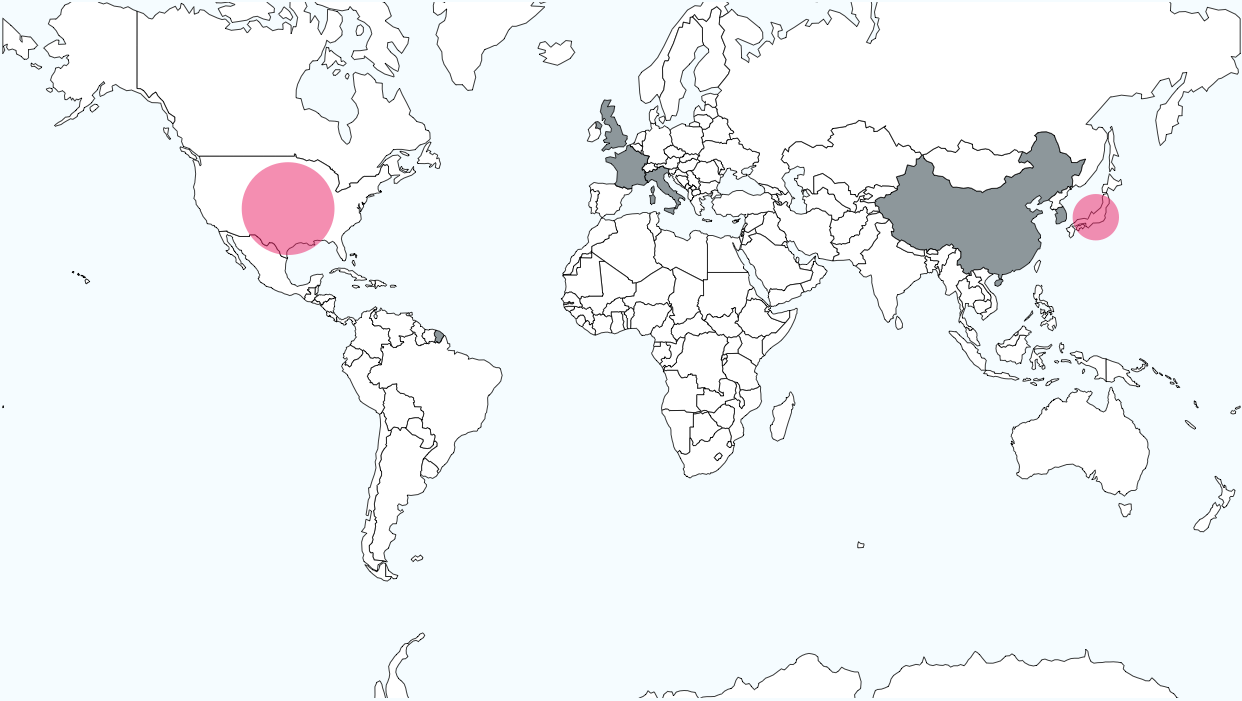
今回は、画面上に世界地図を表示する方法についてです。
イメージは下記の感じです。
使用しているライブラリ
d3-geoi18n-iso-countriesreact-native-svgtopojson-clientworld-countries
実装方法
まずはマップデータ必要です。
日本地図はちょっと骨が折れるのですが、世界地図はこのデータを使えば簡単に対応できます。
import worldData from 'src/assets/data/world-110m.json'
import { feature } from 'topojson-client';

const WorldMapPage: React.FunctionComponent = () => {
  const mapData = feature(worldData, worldData.objects.countries).features;
  ...
画面上にスポット(赤い丸)や、国を塗りつぶしたい場合は下記のように実装します。
スポット
import countries from 'world-countries';
...
const WorldMapPage: React.FunctionComponent = () => {
  ...
  const spotGeos = [
    { code: 'JPN', volume: 15 },
    { code: 'USA', volume: 30 },
  ];
  spotGeos.reduce((acc, sg) => {
      const country = countries.find((c) => c.cca3 === sg.code);
      if (!country || !country.latlng) return acc;

      acc.push({
        coordinates: country.latlng.slice().reverse(),
        volume: sg.volume,
      });
      return acc;
    }, [] as any);
国のカラーリング
import isoCountries from 'i18n-iso-countries';
...
const WorldMapPage: React.FunctionComponent = () => {
  ...
  const paintCountry = [
    { id: 'CHN' },
    { id: 'HKG' },
    { id: 'GBR' },
    { id: 'FRA' },
    { id: 'ITA' },
    { id: 'KOR' },
  ];
  const getColor = (numericId: string) => {
    const alpha3 = isoCountries.numericToAlpha3(numericId);
    return paintCountry.find((c) => c.id === alpha3)
      ? `rgba(38,50,56,0.5)`
      : `rgba(255,255,255,1)`;
  };
メルカトル図法上にプロットできるように、マッピング関数を定義します。
const viewWidth = 800;
const viewHeight = 450;

const projectMercator = () =>
  geoMercator()
    .scale(viewWidth / ((2 * Math.PI * (360 - 0)) / 360))
    .center([0, 0])
    .translate([viewWidth / 2, viewHeight / 2])
これで準備は完了です。
あとは react-native-svg を用いて、画面上に描写します。
<Svg
  width={size}
  height={size * (viewHeight / viewWidth)}
  viewBox={`0 0 ${viewWidth} ${viewHeight}`}
>
  <G>
    {mapData.map((d, i) => {
      return (
        <Path
          key={`path-${i}`}
          d={geoPath().projection(projectMercator())(d)}
          fill={`${getColor(d.id)}`}
          stroke="#000000"
          strokeWidth={0.5}
        />
      );
    })}
  </G>
  <G>
    {spots &&
      spots.length > 0 &&
      spots.map((sg, i) => (
        <Circle
          key={`circle-${i}`}
          cx={projectMercator()(sg.coordinates)[0]}
          cy={projectMercator()(sg.coordinates)[1]}
          r={sg.volume}
          fill={`rgba(233,30,99,0.5)`}
        />
      ))}
  </G>
</Svg>
size はここでは画面幅を取得して設定しています。
上記の手順で、国の塗りつぶしと、地図上に円をプロットすることができました。
日本地図を描きたい場合は、日本地図用のデータを取得する必要があります。
また、世界地図と比べて縮尺が異なるので微調整が必要です。
データさえ用意できれば、描写は同様の手法で実現可能となります。
おわりに
今回は、半年間、投稿が遠のいてしまいました。
ニッチな知見は整理して、言語化して少しずつ記事にできればと思います。