contrib-blockdiag 1.5.5
この投稿は公式のブロック図生成ツールblockdiagのドキュメントに依る
自分ドキュメントを書くときに使いそうなものを中心にサンプルを作成した。
使い方
conf.pyに以下を設定する
conf.py
# Enabled extensions
extensions = ['sphinxcontrib.blockdiag']
# Fontpath for blockdiag (truetype font)
blockdiag_fontpath = 'C:\Windows\Fonts\meiryo.ttc' # メイリオUI標準
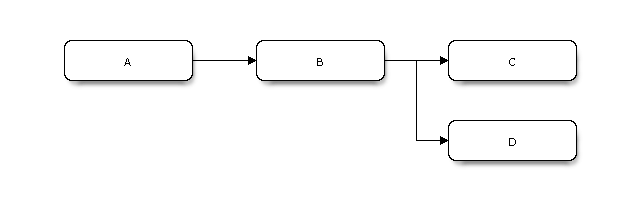
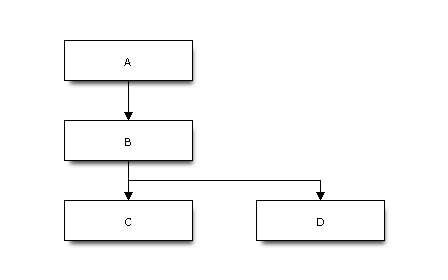
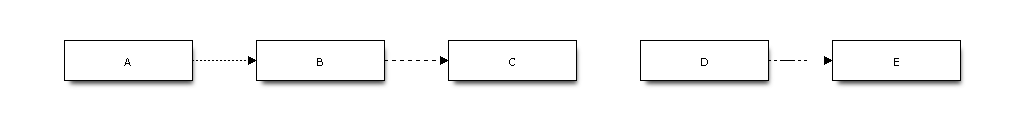
シンプルなサンプル
.. blockdiag::

   diagram {
   // set default shape
   default_shape = roundedbox
     A -> B -> C;
          B -> D;
   }
特に指定しない場合、描画属性は以下が使われる
- node_width = 128;
- node_height = 40;
- span_width = 64;
- span_height = 40;
- default_fontsize = 11;
- default_shape = box;
- orientation = ;
- 無指定は横書き。portrait指定で縦に並ぶ。
- default_node_color = white;
- default_group_color = orange;
- default_linecolor = black;
- default_textcolor = black;
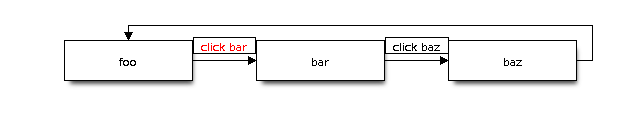
ノードとエッジにラベルをつける
.. blockdiag::

   diagram {
   // Set labels to nodes.
   A [label = "foo"];
   B [label = "bar"];
   C [label = "baz"];

   // Set labels to edges. (short text only)
   A -> B [label = "click bar", textcolor="red"];
   B -> C [label = "click baz"];
   C -> A;
   }
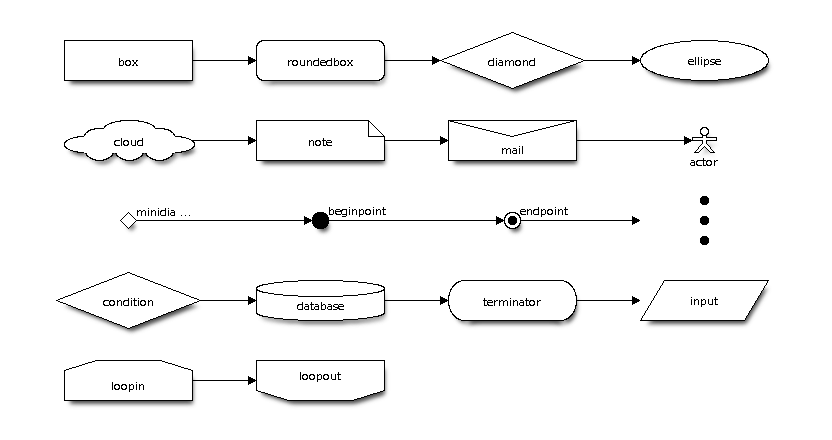
個々のノードに属性を設定する
.. blockdiag::

   diagram {
   // standard node shapes
   box [shape = "box"];
   roundedbox [shape = "roundedbox"];
   diamond [shape = "diamond"];
   ellipse [shape = "ellipse"];
   note [shape = "note"];

   cloud [shape = "cloud"];
   mail [shape = "mail"];
   beginpoint [shape = "beginpoint"];
   endpoint [shape = "endpoint"];
   minidiamond [shape = "minidiamond"];
   actor [shape = "actor"];
   dots [shape = "dots"];

   box -> roundedbox -> diamond -> ellipse;
   cloud -> note -> mail -> actor;
   minidiamond -> beginpoint -> endpoint -> dots;

   // node shapes for flowcharts
   condition [shape = "flowchart.condition"];
   database [shape = "flowchart.database"];
   input [shape = "flowchart.input"];
   loopin [shape = "flowchart.loopin"];
   loopout [shape = "flowchart.loopout"];
   terminator [shape = "flowchart.terminator"];

   condition -> database -> terminator -> input;
   loopin -> loopout;
   }
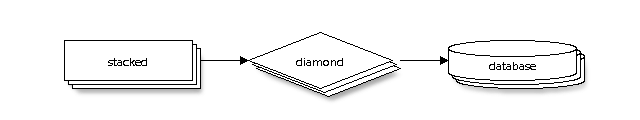
ノードのスタック(重ね合わせ)
.. blockdiag::

   diagram {
   // Set stacked to nodes.
   stacked [stacked];
   diamond [shape = "diamond", stacked];
   database [shape = "flowchart.database", stacked];

   stacked -> diamond -> database;
   }
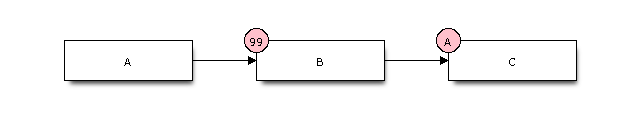
ノードに番号を振る
.. blockdiag::

   diagram {
   // Set numbered-badge to nodes.
   B [numbered = 99];
   C [numbered = A];

   A -> B -> C;
   }
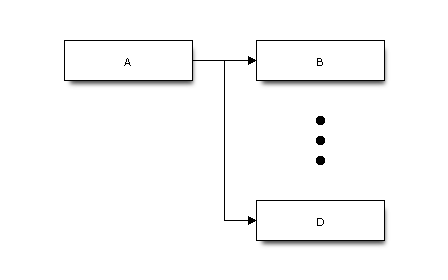
ノードの省略を表現する
.. blockdiag::

   diagram {
   A -> B, C, D;
   C [shape = "dots"];
   // hide edge forward to dots node
   A -> C [style = "none"];
   }
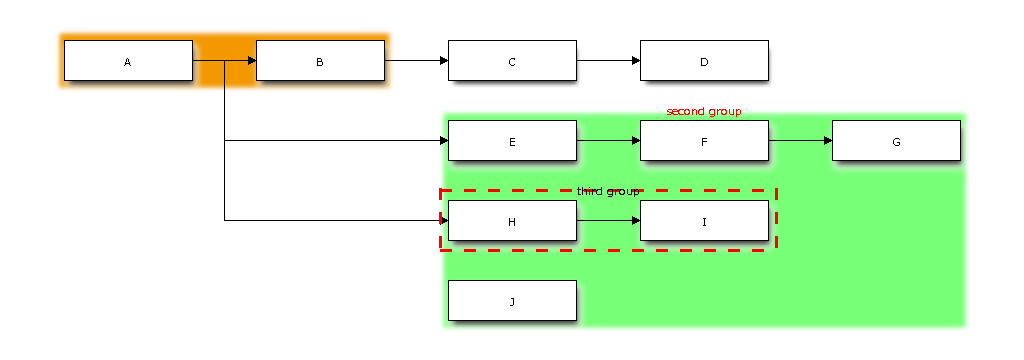
ノードをグルーピングする
.. blockdiag::

   diagram {
   A -> B -> C -> D;
   A -> E;
   A -> H;

   // A and B belong to first group.
   group {
      A; B;
   }

   // E, F and G belong to second group.
   group second_group {
      // Set group-label
      label = "second group";

      // Set background-color to this group.
      color = "#77FF77";

      // Set textcolor to this group
      textcolor = "#FF0000";

      E -> F -> G;

      // H and I belong to third "nested" group.
      group {
          label = "third group";
          color = "#FF0000";

          // Set group shape to 'line group' (default is box)
          shape = line;

          // Set line style (effects to 'line group' only)
          style = dashed;

          H -> I;
      }
   }

   // J belongs to second group
   J [group = second_group];
   }
縦に並べる
.. blockdiag::

   diagram {
   orientation = portrait

   A -> B -> C;
        B -> D;
   }
クラスを使って属性を定義する
Sphinx向けには実装されていない。
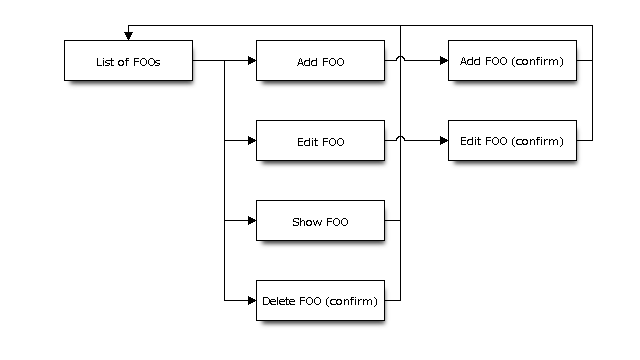
シンプルな管理画面の画面遷移図(例)
.. blockdiag::

   diagram {
   index [label = "List of FOOs"];
   add [label = "Add FOO"];
   add_confirm [label = "Add FOO (confirm)"];
   edit [label = "Edit FOO"];
   edit_confirm [label = "Edit FOO (confirm)"];
   show [label = "Show FOO"];
   delete_confirm [label = "Delete FOO (confirm)"];

   index -> add  -> add_confirm  -> index;
   index -> edit -> edit_confirm -> index;
   index -> show -> index;
   index -> delete_confirm -> index;
   }
ノードに説明をつけて表と同時に生成する
.. blockdiag::
   :desctable:

   {
   // Set numbered-badge and description to nodes.
   A [numbered = 1, label = "Input", description = "Beef, carrots, potatoes, curry powder and water"];
   B [numbered = 2, label = "Process", description = "Simmer and simmer"];
   C [numbered = 3, label = "Output", description = "yum-yum curry"];

   A -> B -> C;
   }
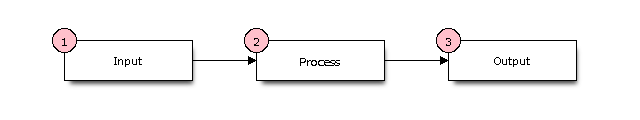
| No | Name | Description |
|---|---|---|
| 1 | Input | Beef, carrots, potatoes, curry powder and water |
| 2 | Process | Simmer and simmer |
| 3 | Output | yum-yum curry |
ノードにスタイルを設定する
.. blockdiag::

   diagram {
   // Set boder-style to nodes.
   B [style = dotted];
   C [style = dashed];
   D [style = "3,3,3,3,15,3"];

   A -> B -> C -> D;
   }
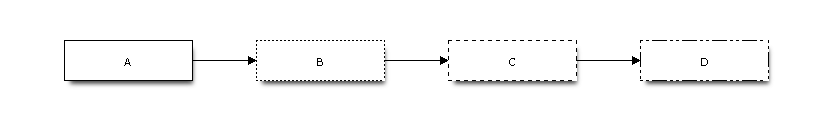
エッジにスタイルを設定する
.. blockdiag::

   diagram {
   // Set style to edges.
   A -> B [style = dotted];
   B -> C [style = dashed];
   C -> D [style = none];
   D -> E [style = "3,3,3,3,15,3"];
   }
おまけ
contrib-nwdiag 0.9.5
この投稿は公式の ネットワーク図生成ツール nwdiag のドキュメントに依る
自分ドキュメントを書くときに使いそうなものを中心にサンプルを作成した。
使い方
conf.pyに以下を設定する
conf.py
# Enabled extensions
extensions = ['sphinxcontrib.nwdiag',
              'sphinxcontrib.rackdiag',
              'sphinxcontrib.packetdiag']
# Fontpath for nwdiag series (truetype font)
nwdiag_fontpath = 'C:\Windows\Fonts\meiryo.ttc' # メイリオUI標準
シンプルなサンプル
.. nwdiag::
   :desctable:

   nwdiag {
   network dmz {
      address = "210.x.x.x/24"

      web01 [address = "210.x.x.1"];
      web02 [address = "210.x.x.2"];
      }
   network internal {
      address = "172.x.x.x/24";

      web01 [address = "172.x.x.1"];
      web02 [address = "172.x.x.2"];
      db01;
      db02;
      }
   }
ノードに説明をつけて表と同時に生成する
.. nwdiag::
   :desctable:

   nwdiag {
      network {
        A [address = 192.168.0.1, description = "web server01"];
        B [address = 192.168.0.2, description = "web server02"];
      }
      network {
        A [address = 172.0.0.1];
        C [address = 172.0.0.2, description = "database server"];
      }
   }
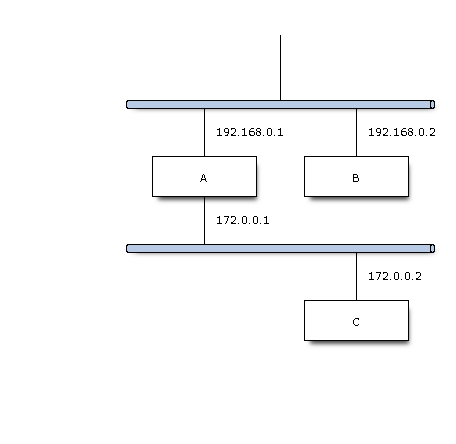
| Name | Description |
|---|---|
| A | web server01 |
| B | web server02 |
| C | database server |
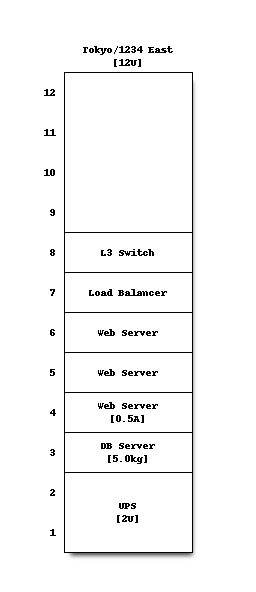
ラック図のサンプル
.. rackdiag::

   rackdiag {
   // define height of rack
   12U;

   // define description of rack
   description = "Tokyo/1234 East";

   // define rack units
   1: UPS [2U];   // define height of unit
   3: DB Server [5kg]  // define weight of unit
   4: Web Server [0.5A]  // define ampere of unit
   5: Web Server
   6: Web Server
   7: Load Balancer
   8: L3 Switch
   }