本記事はgnuplotの基本的な操作は行えるとして、論文や発表に挿入する図やGIFをある程度綺麗にgnplotで作る方法についての私自身の備忘録として残しておく。(随時更新予定)
gnuplotでグラフを書く
一般にgnuplotを用いてグラフを描くと
set term png
set output "output.png"
plot x**2
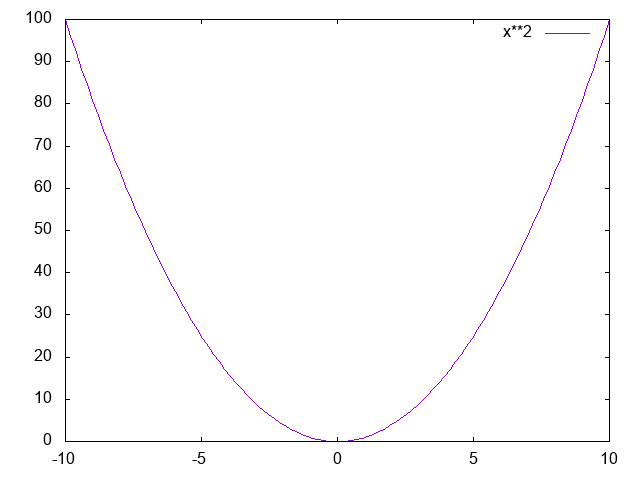
・・・はっきり言ってダサい。
凡例がダサすぎる。数式の凡例なのだからTimes系フォントで書くべきだ。
そこでcairoというターミナル形式を用いてみる。
cairoについて
cairoはgnuplotのインストールの際にオプションで指定する必要がある。 以下のページを参照するとわかりやすい。 **[gnuplotをHomebrewからインストールするときの手順](https://qiita.com/noanoa07/items/a20dccff0902947d3e0c)**set term pngcairo enhanced #enhancedは拡張テキストモードである。
set output "output.png"
plot x**2 title "{/Times-Italic x^2}"
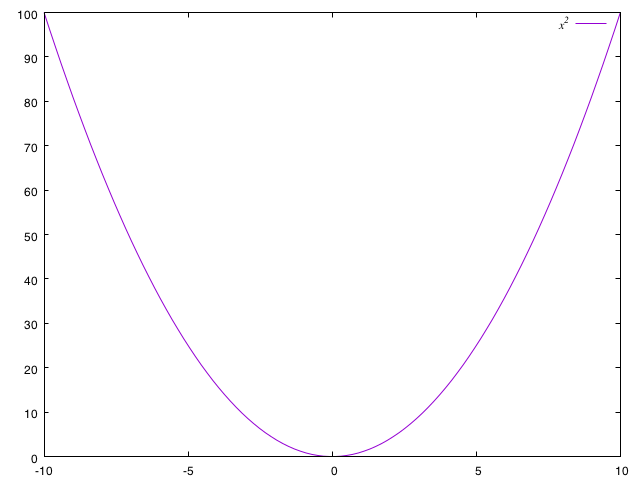
若干マシになっただろうか。title "{/Times-Italic x^2}" のところは各々自分のお好みのフォントを使えばいいと思う。(もちろん数式なのだからTimes系フォントが好ましいが・・・)
こんなことしなくてもepslatexを使えばいいじゃないかという声もあるだろうが、初めてTeXやパワーポイントに挿入する際にepsはややこしすぎる。と思う。
pdfやpngならもう少し直感的に挿入できると感じる。