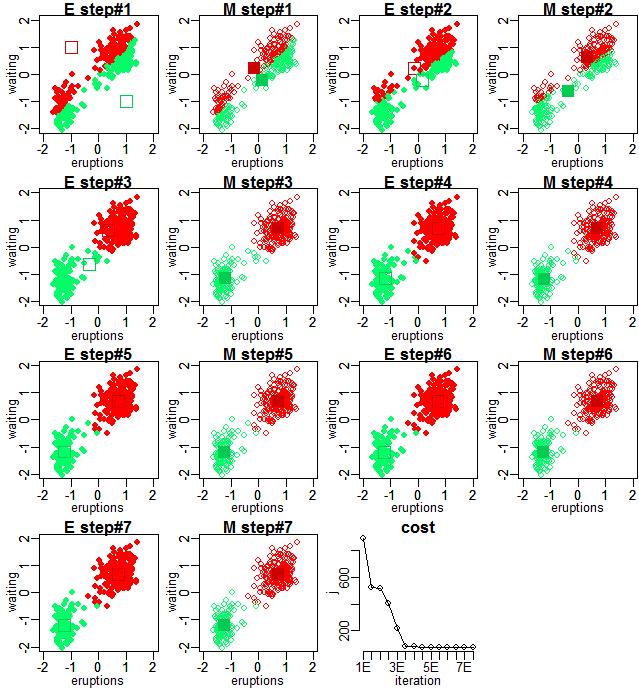
PRML 9.1に記載の通り、K-meansクラスタリングが行われる過程と、コスト関数の収束の様子を示します。
library(MASS)
frame()
set.seed(0)
par(mfrow=c(4, 4))
par(mar=c(2.5, 2.5, 1, 0.1))
par(mgp=c(1.3, 0.5, 0))
xrange <- c(-2, 2)
yrange <- c(-2, 2)
D <- 2
K <- 2
data(faithful)
x <- as.matrix(faithful)
N <- nrow(x)
# N <- 100
# x <- mvrnorm(N / 2, c(-1, -1), matrix(c(.4, 0, 0, .4), D))
# x <- rbind(x, mvrnorm(N / 2, c(1, 1), matrix(c(.4, 0, 0, .4), D)))
x <- t((t(x) - apply(x, 2, mean)) / apply(x, 2, sd))  # normalize
mu <- matrix(c(-1, 1, 1, -1), K, byrow=T)
r <- matrix(NA, nrow=N, ncol=K)
j <- numeric()

cost <- function() {
	sum(sapply(1:N, function(n)
		sum(r[n, ] * rowSums(t(x[n, ] - t(mu)) ^ 2))
		))
}

iteration <- 0
repeat {
	iteration <- iteration + 1

	# E step
	for (n in 1:N) {
		diff <- numeric(K)
		for (k in 1:K) {
			diff[k] <- sum((x[n, ] - mu[k, ]) ^ 2)
		}
		minK <- which.min(diff)
		r[n, minK] <- 1
		r[n, -minK] <- 0
	}
	j <- c(j, cost())
	plot(x, xlim=xrange, ylim=yrange, col=hsv(0.4 * apply(r, 1, function(r) which(r == 1) - 1)), pch=16)
	par(new=T)
	plot(mu, xlim=xrange, ylim=yrange, xlab="", ylab="", col=hsv((1:K - 1) * 0.4, 1, 0.8), pch=0, cex=2)
	title(paste0("E step#", iteration))

	# M step
	for (k in 1:K) {
		mu[k, ] <- colSums(x * r[, k]) / sum(r[, k])
	}
	j <- c(j, cost())
	plot(x, xlim=xrange, ylim=yrange, col=hsv(0.4 * apply(r, 1, function(r) which(r == 1) - 1)), pch=1)
	par(new=T)
	plot(mu, xlim=xrange, ylim=yrange, xlab="", ylab="", col=hsv((1:K - 1) * 0.4, 1, 0.8), pch=15, cex=2)
	title(paste0("M step#", iteration))

	if (length(j) > 2 && j[length(j)] == j[length(j) - 2]) {
		break
	}
}

names(j) <- paste0(rep(1:(length(j) / 2), each=2), c("E", "M"))
plot(j, type="o", axes=F, xlab="iteration")
axis(1, at=1:length(j), labels=names(j))
axis(2)
title("cost")