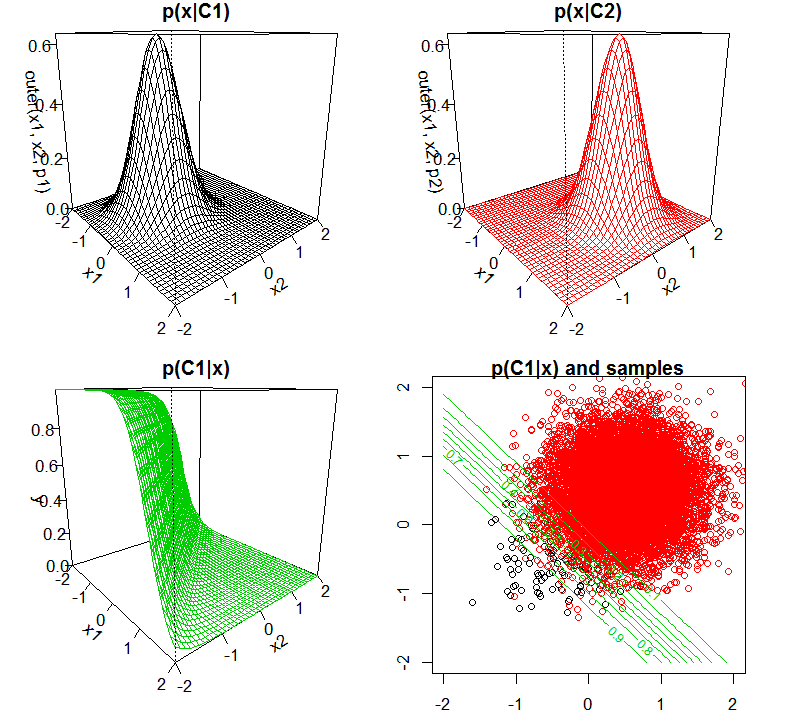
PRML図4.10と同様に、2つのクラスの条件付き確率密度(それぞれ同じ共分散行列を持つ2次元正規分布)を図示し、さらに、それらの条件付き確率密度とクラスの事前確率から求めた事後確率を図示します。また、このモデルに従ってサンプルを生成します。サンプルからモデルパラメータを求めているわけではありません。なお、2つのクラスの事前確率が100倍異なるものとしています。
library(mvtnorm)
frame()
set.seed(0)
par(mfrow=c(2, 2))
par(mar=c(2, 2, 1, 2))
par(mgp=c(2, 1, 0))
xrange <- c(-2, 2)
yrange <- c(-2, 2)
x1 <- seq(xrange[1], xrange[2], .1)
x2 <- seq(yrange[1], xrange[2], .1)

sigma <- matrix(c(0.5^2, 0, 0, 0.5^2), 2)
u1 <- c(-0.5, -0.5)
u2 <- c(0.5, 0.5)
N1 <- 100
N2 <- 10000
precision <- solve(sigma)
w <- precision %*% (u1 - u2)
w0 <- as.numeric((t(u1) %*% precision %*% u1 + t(u2) %*% precision %*% u2) / 2 + log(N1 / N2))
print(w)
print(w0)
base <- function(x1, x2) {
        (cbind(x1, x2))
}
logistic <- function(x) {
        1 / (1 + exp(-x))
}
estimate <- function(x1, x2){
        logistic(t(w) %*% t(base(x1, x2)) + w0)
}

p1 <- function(x1, x2) {
        dmvnorm(cbind(x1, x2), u1, sigma)
}
persp(x1, x2, outer(x1, x2, p1), xlim=xrange, ylim=yrange, border=1, theta=50, ticktype="detailed", main="p(x|C1)")

p2 <- function(x1, x2) {
        dmvnorm(cbind(x1, x2), u2, sigma)
}
persp(x1, x2, outer(x1, x2, p2), xlim=xrange, ylim=yrange, border=2, theta=50, ticktype="detailed", main="p(x|C2)")

y <- outer(x1, x2, estimate)
persp(x1, x2, y, xlim=xrange, ylim=yrange, border=3, theta=50, ticktype="detailed", main="p(C1|x)")

x <- rmvnorm(N1, u1, sigma)
d <- as.data.frame(cbind(x, 1))
x <- rmvnorm(N2, u2, sigma)
d <- rbind(d, as.data.frame(cbind(x, 2)))
names(d) <- c("x1", "x2", "class")
plot(d$x1, d$x2, col=d$class, xlim=xrange, ylim=yrange)
contour(x1, x2, y, xlim=xrange, ylim=yrange, col=3, add=T)
title(main="p(C1|x) and samples")