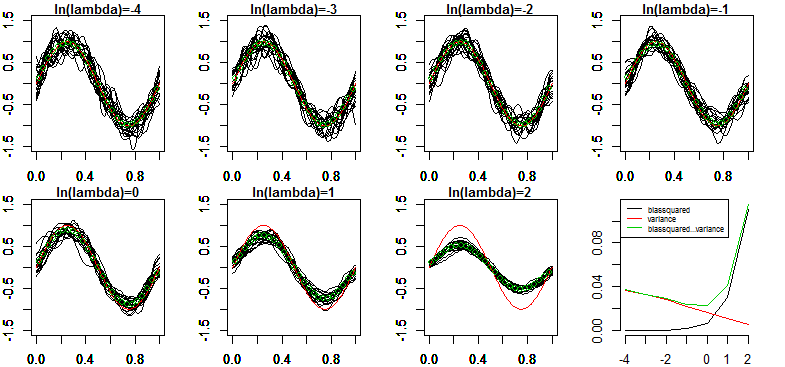
PRML図3.5と同様に、25個のガウス基底で構成される線形基底関数モデルにおいて、正則化パラメータごとに、25点のサンプルデータ集合の生成とパラメータの学習を200回繰り返し、各モデル(20回分のみ描画)とその平均値を描きます。またその結果から、モデルの正則化パラメータごとに、モデルの期待損失を構成するバイアスとバリアンスを求めて、図3.6と同様の図を描きます。
frame()
set.seed(0)
N<-25
M<-25
ATTEMPT=200
xrange<-c(-0.0,1.0)
yrange<-c(-1.5,1.5)
x<-seq(1/(N*2), 1, 1/N)
base<-function(m,x) {
#        r<-x^m                          #多項式基底の場合
        r<-exp(-(x-(m-1)/(M-2))^2/(2*0.05^2))    #ガウス基底の場合
        r[m == 0]<-1                    # w0をバイアス項とするためφ0=1
        r
}
makePhi<-function(M) {
        A <- matrix(nrow=length(x),ncol=M)
        for (i in 1:length(x)) {
                for (j in 0:(M-1)) {
                        A[i,1+j] <- base(j,x[i])
                }
        }
        A
}
biassquared<-numeric(5)
variance<-numeric(5)
is<-1:7
lambdabase<-is-5
lambda<-exp(lambdabase)
par(mfrow=c(2,4))
for (i in is) {
	h<-function(x){sin(2*pi*x)}
	curve(h,type="l",xlim=xrange,ylim=yrange,col=2,ylab="t")
	title(paste0("ln(lambda)=", lambdabase[i]), cex.main=1)
	y=matrix(nrow=length(x),ncol=ATTEMPT)
	for (attempt in 1:ATTEMPT) {
		t<-sin(2*pi*x)+rnorm(N, 0, 0.5^2)
		t<-matrix(t,nrow=length(t))
		phi<-makePhi(M)
		w<-solve(lambda[i] * diag(M) + t(phi) %*% phi) %*% t(phi) %*% t
		estimate<-function(x){
			i <- 0:(M-1)
			(sapply(x,function(xn){ (sum(w * base(i, xn))) } )) # (w[1]+w[2]*base(1,x)+w[3]*base(2,x)...)
		}
		y[,attempt]<-estimate(x)
		if (attempt <= 20) {
			par(new=T)
			curve(estimate,type="l",xlim=xrange,ylim=yrange,col=1,ylab="")
		}
	}
	meany<-apply(y, 1, mean)
	par(new=T)
	curve(h,type="l",xlim=xrange,ylim=yrange,col=2,ylab="t")
	par(new=T)
	plot(x, meany, xlim=xrange,ylim=yrange,col=3,ylab="")
	biassquared[i]<-mean((meany - h(x))^2)
	variance[i]<-mean((y - meany)^2)

}
d<-data.frame(biassquared,variance,biassquared+variance)
rownames(d)<-lambdabase
matplot(d,type="l",axes=F,lty=1)
axis(1,1:length(lambdabase),lambdabase)
axis(2)
legend("topleft",legend=colnames(d),col=1:ncol(d),lty=1,cex=0.6)
