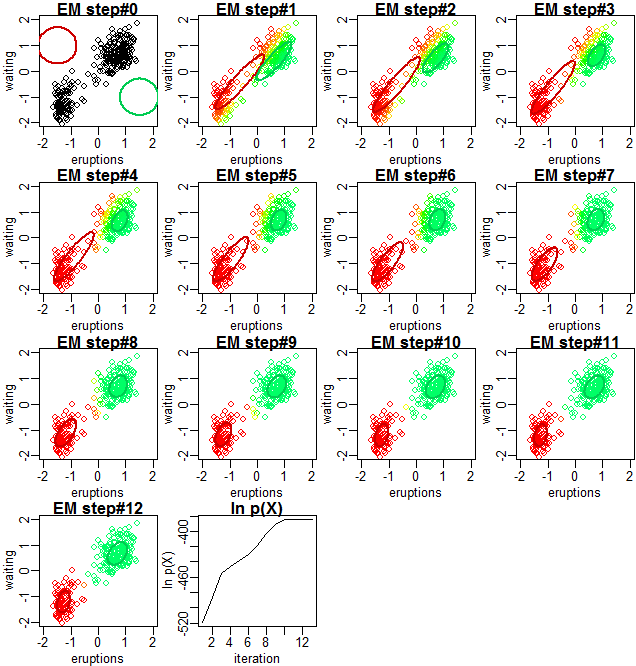
PRML 9.2.2に記載の通り、EMアルゴリズムによって混合ガウスモデルの最尤推定が行われる過程と、対数尤度関数の収束の様子を示します。
library(mvtnorm)
library(plotrix)
frame()
set.seed(0)
par(mfrow=c(4, 4))
par(mar=c(2.5, 2.5, 1, 0.1))
par(mgp=c(1.5, .5, 0))
xrange <- c(-2, 2)
yrange <- c(-2, 2)
D <- 2
K <- 2
data(faithful)
x <- as.matrix(faithful)
N <- nrow(x)
# N <- 100
# x <- rmvnorm(N / 2, c(-1, -1), matrix(c(.4, 0, 0, .4), D))
# x <- rbind(x, rmvnorm(N / 2, c(1, 1), matrix(c(.4, 0, 0, .4), D)))
x <- t((t(x) - apply(x, 2, mean)) / apply(x, 2, sd))  # normalize
mu <- matrix(c(-1.5, 1, 1.5, -1), K, byrow=T)
sigma <- rep(list(diag(0.5, D)), K)
pz <- rep(1 / K, K)
gamma <- matrix(NA, nrow=N, ncol=K)
likelihood <- numeric()

iteration <- 0
repeat {
	cat("mu\n");print(mu)
	cat("sigma\n");print(sigma)
	cat("pi\n");print(pz)

	plot(x, xlim=xrange, ylim=yrange, col=ifelse(is.na(gamma[, 2]), 1, hsv(gamma[, 2] * .4)), pch=1)
	for (k in 1:K) {
		e <- eigen(sigma[[k]])
		draw.ellipse(mu[k, 1], mu[k, 2], sqrt(e$values[1]), sqrt(e$values[2]),
			atan2(e$vectors[2, 1], e$vectors[1, 1]) / pi * 180,
			border=hsv((k - 1) * .4, 1, 0.8), lwd=2)
	}
	title(paste0("EM step#", iteration))

	# E step
	for (n in 1:N) {
		pzx <- sapply(
			1:K,
			function(k) pz[k] * dmvnorm(x[n, ], mean=mu[k, ], sigma=sigma[[k]])
			)
		gamma[n, ] <- pzx / sum(pzx)
	}

	# M step
	nk <- colSums(gamma)
	for (k in 1:K) {
		mu[k, ] <- colSums(x * gamma[, k]) / nk[k]
		sigma[[k]] <- matrix(
			rowSums(sapply(1:N, function(n) gamma[n, k] * outer(x[n, ] - mu[k, ], x[n, ] - mu[k, ]))),
			D) / nk[k]
		pz[k] <- nk[k] / N
	}

	# likelihood
	likelihood <- c(likelihood, sum(sapply(1:N, function(n)
			log(sum(sapply(
				1:K,
				function(k)
					pz[k] * dmvnorm(x[n, ], mean=mu[k, ], sigma=sigma[[k]])
				)))
			)))

	if (length(likelihood) > 1
		&& likelihood[length(likelihood)] - likelihood[length(likelihood) - 1] < 1.0E-2) {
		break
	}
	iteration <- iteration + 1
}

plot(likelihood, type="l", xlab="iteration", ylab="ln p(X)")
title("ln p(X)")