0
0

Delete article

Deleted articles cannot be recovered.

Draft of this article would be also deleted.

Are you sure you want to delete this article?

More than 3 years have passed since last update.

GCP で Latency を計測し可視化する

Last updated at Posted at 2021-01-07

はじめに

Regression Test で Web Application のレイテンシを計測する話です。

レイテンシの機械的な集計

以前の記事でも書いていますが、レガシーな monolithic な system を Cloud に Lift & Shift を行っています。
数百ある Web-API の性能劣化の有無を確認するため、Production 環境の Packet をリプレイしています。

この結果を機械的に集計する方法について。

Web サーバーの log に処理時間を出力し、それを集計するというのが、当初の計画でした。
conf の Log format を変更して、それを集計する。

対応策

より効率的な方法を考察し、たどり着いたのは、LoadBarancer の log にある latency を bq で集計する。

log-query
severity=INFO
httpRequest.requestMethod="POST"
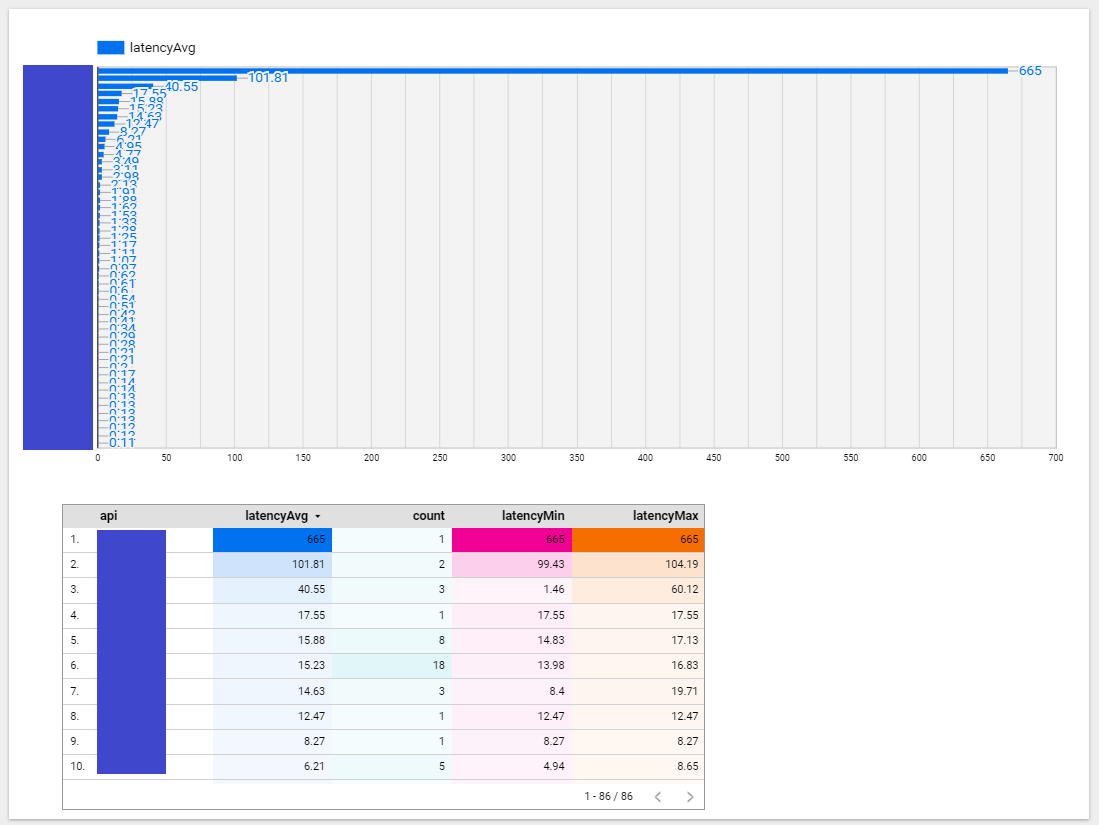
  1. logging をシンクで bq に送る。
  2. bq でクエリを作成する。対象は、httpRequest.requestUrl httpRequest.latency
  3. データポータルを作成する。
  4. カスタムクエリでデータを抽出する。
  5. グラフを作成する。

qiita_1.PNG

これで、解決しました。

まとめ

これがベストなのかは、考察を続けたいと思います。
以上。

皆さんの参考になれば幸いです。
0
0
0

Register as a new user and use Qiita more conveniently

  1. You get articles that match your needs
  2. You can efficiently read back useful information
  3. You can use dark theme
What you can do with signing up
0
0

Delete article

Deleted articles cannot be recovered.

Draft of this article would be also deleted.

Are you sure you want to delete this article?