svd fitting
cc by Shigeto R. Nishitani, 2023
簡単な最小二乗法によるfittingでも計算誤差が出てしまうという例です.0からだいぶ離れたところで,微妙なエネルギー差をfittingしようとして出てきました.
結論はSVD(single value decomposition, 特異値分解)を使えというNumRecipeの教えを再確認...やれやれ.
最初のうまくいってない結果
- include NumericCalcs
- fit
- plot
Ruby module for Numerical calculations
  require "matrix"
  require "rbplotly"

  module NumericCalcs
    include Math

    def fitting(x, d_y, dim = 3)
      y = d_y

      # make design matrix
      n, m = x.size, dim

      av = Matrix.zero(n, m)
      yy = Vector.zero(n)
      n.times do |i|
        m.times do |j|
          av[i,j] = x[i] ** j
        end
        yy[i] = y[i]
      end

      # calc inverse for non-square matrix
      ai = (av.transpose * av).inv
      b = av.transpose * yy
      return ai * b
    end

    def polynomials(coeffs, x)
      sum = 0.0
      coeffs.each_with_index do |c, i|
        sum += c * x ** i
      end
      sum
    end

    # x_ticks
    def mk_x(init, fin, dev)
      x = []
      (init..fin).step(dev) { |i| x << i }
      x
    end

    def plot_data_and_func(xx, y_vals, func)
      dev = (xx.max - xx.min) / 100.0
      xx2 = mk_x(xx.min, xx.max, dev)

      traces = [{ x: [], y: [], name: "data" },
                { x: [], y: [], name: "fitted func" }]

      xx.size.times do |i| # rev for Numo::DFloat
        traces[0][:x] << xx[i]
        traces[0][:y] << y_vals[i]
      end

      xx2.each do |x|
        traces[1][:x] << x
        traces[1][:y] << func.call(x)
      end
      pl = Plotly::Plot.new(data: traces)
      Plotly.default_auth()
      return pl
    end
  end

  include NumericCalcs
#<Module:0x000000013e3cd518>
  p x_vals = [950, 960, 970, 980, 990]
  p y_vals = [-4.177412829697432, -4.1848393364765, -4.192296922237924,
      -4.199785335389045, -4.207304330283102]
[950, 960, 970, 980, 990]
[-4.177412829697432, -4.1848393364765, -4.192296922237924, -4.199785335389045, -4.207304330283102]


[-4.177412829697432, -4.1848393364765, -4.192296922237924, -4.199785335389045, -4.207304330283102]
main results
  xx=x_vals
  yy = y_vals
  p vals=fitting(xx, yy, 4)

  f_plot = lambda { |x| polynomials(vals, x) }
  pl = plot_data_and_func(xx, yy, f_plot)
  pl.show
  #pl.savefig('./figs/fit_plot0.png')
Vector[-3.650146484375, -0.0003299713134765625, -2.7194619178771973e-07, 4.1382008930668235e-11]
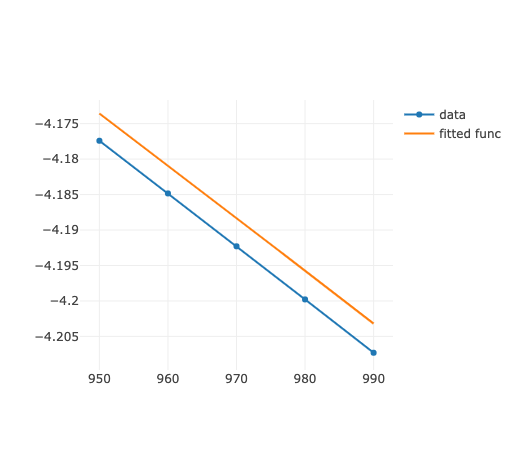
というのが default 計算の結果. これを改善できないかという話.
少し試行錯誤
明らかにずれていて,Maple の fitting を使うとばっちり.NumericCalcs::fitting が甘いのはあきらかだが,どうすれば...
  av = Matrix[[1, 950, 902500, 857375000], [1, 960, 921600, 884736000], [1, 970, 940900, 912673000], [1, 980, 960400, 941192000], [1, 990, 980100, 970299000]]
  yy = Vector[-4.177412829697432, -4.1848393364765, -4.192296922237924, -4.199785335389045, -4.207304330283102]

  ai = (av.transpose * av).inv
  b = av.transpose * yy
  ai * b
Vector[-3.650146484375, -0.0003299713134765625, -2.7194619178771973e-07, 4.1382008930668235e-11]
すると確かに.おなじ.
でも,これを Maple でやるとまた違った答え
[-3.650634765625, -0.0003314018249511719, -0.2756714821*10^(-6), 0.4160938261*10^(-10)])
になる.これは,数値誤差(Ruby の inv かな)のようなんで,放置.
1000->1 に(効果なし)
  x_vals2 = [950, 960, 970, 980, 990]
  x_vals2.map!{|val| val/1000.0}
  y_vals = [-4.177412829697432, -4.1848393364765, -4.192296922237924,
      -4.199785335389045, -4.207304330283102]
[-4.177412829697432, -4.1848393364765, -4.192296922237924, -4.199785335389045, -4.207304330283102]
  xx=x_vals2
  yy = y_vals
  vals=fitting(xx, yy, 4)

  f_plot = lambda { |x| polynomials(vals, x) }
  pl = plot_data_and_func(xx, yy, f_plot)
  pl.show
  #pl.savefig('./figs/fit_fail1.png')
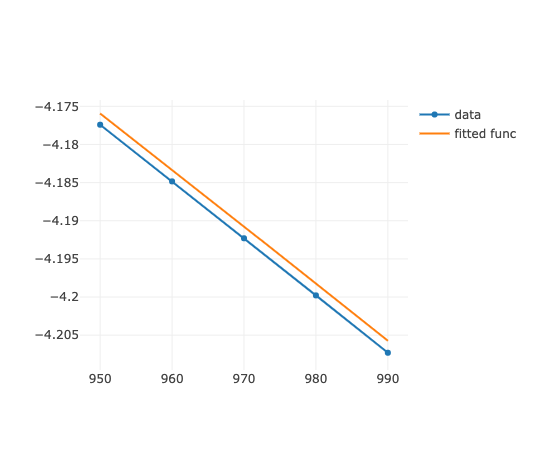
ちょっと変わりますが,差は大きいです.
Ruby の svd
Numo の導入
steep なんやろな.なら,SVD だが.Ruby にあったっけ?
  > gem install ruby-svd
  > emacs /Users/bob/.rbenv/versions/3.0.2/lib/ruby/gems/3.0.0/extensions/arm64-darwin-20/3.0.0/ruby-svd-0.5.1/gem_make.out
うーーん.gccのcompile エラー.
numo がそのまま動いた.へぇ,やるね.2年ほど前に動かなんでNumoを使ったコードをMatrixに書き換えたんですが...
どこが対応したんやろ... -Adddynamic_lookup linker option for macOS and Ruby3.1と4ヶ月ほど前に修正したはります
  require 'numo/gnuplot'
  require 'numo/narray'
  require 'numo/linalg'

  x, y=x_vals, y_vals

  # make design matrix
  n = 5 # data
  m = 4 # dimension
  av = Numo::DFloat.zeros(n, m)
  yy = Numo::DFloat.zeros(n)
  n.times do |i|
    m.times do |j|
      av[i,j]=x[i]**j
    end
    yy[i] = y[i]
  end

  # fit by using matrix inv
  p ai = Numo::Linalg.inv(Numo::Linalg.dot(av.transpose,av))
  p b = Numo::Linalg.dot(av.transpose,yy)
  $vars = Numo::Linalg.dot(ai,b)
  p ['$vars', $vars]

  # block for lazy evaluation in plot_data_and_func
  free_e_plot = lambda { |x| polynomials($vars, x) }

  pl = plot_data_and_func(x, y, free_e_plot)
  pl.show
Numo::DFloat#shape=[4,4]
[[5.78259e+10, -1.7888e+08, 184428, -63.3749],
 [-1.7888e+08, 553356, -570.525, 0.196052],
 [184428, -570.525, 0.588234, -0.00020214],
 [-63.3749, 0.196052, -0.00020214, 6.94638e-08]]
Numo::DFloat#shape=[4]
[-20.9616, -20333.5, -1.97284e+07, -1.91454e+10]
["$vars", Numo::DFloat#shape=[4]
[-3.64941, -0.000331879, -2.73809e-07, 4.18368e-11]]
少し変わってるのも(Matrix計算精度が)気になるけど,まあ,変わらんはね.
Numoの動作確認
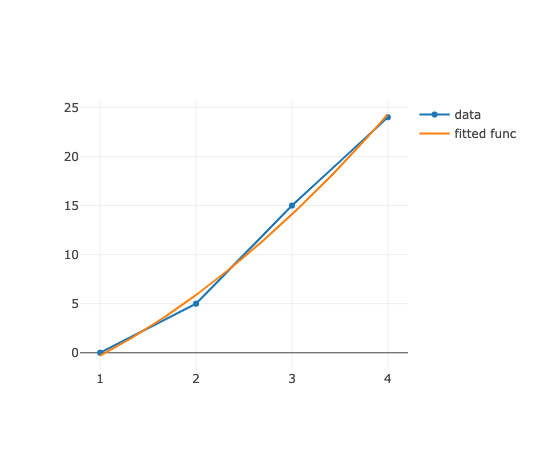
SVDでの実装ですが,先ずは,講義のサイトから確実に動くのを取り出して,確認.
  x = Numo::NArray[[1,2,3,4]]
  y = Numo::NArray[[0,5,15,24]]

  fitting(x,y)
Vector[(-9/2), (16/5), (1/1)]
  x = Numo::NArray[[1,2,3,4]]
  y = Numo::NArray[[0,5,15,24]]

  # make design matrix
  n, m = 4, 3 # data, dimension
  av = Numo::DFloat.zeros(n, m)
  yy = Numo::DFloat.zeros(n)
  n.times do |i|
    m.times do |j|
      av[i,j]=x[i]**j
    end
    yy[i] = y[i]
  end

  # fit by using matrix inv
  require 'numo/linalg'
  ai = Numo::Linalg.inv(Numo::Linalg.dot(av.transpose,av))
  b = Numo::Linalg.dot(av.transpose,yy)
  vars = Numo::Linalg.dot(ai,b)
  p vars

  # block for lazy evaluation in plot_data_and_func
  y_fit = lambda { |x| polynomials(vars, x) }
  pl = plot_data_and_func(x, yy, y_fit)
  pl.show
Numo::DFloat#shape=[3]
[-4.5, 3.2, 1]
Numo の svd の出力順は python と違う
numpy.linalg.svdにある通り,
a : (m,n array)
u,s,vh = linalg.svd(a)で
u : (m , m)
s : (k) よくわかってないよね...
vh : (n, n)
ところが Numo::Linalg.svd では,
s,u,vh = Numo::LInalg.svd(a)
s : k
u : m x m
vh : n x n
という感じ.
これに関するマニュアルはなさそう.ソースが
l.323 Lapack.call(:gesdd, a, jobz:job)[0..2]
となってなるんで,s,u,vの順で正しそう.vは$v^T$とか書いてあったような... 確認して使わないと.
  ss, uu, vs =  Numo::Linalg.svd(av)

  iS = Numo::DFloat.zeros(m, n)
  m.times do |j|
      iS[j,j]=1.0/ss[j]
  end
  p iS

  p left = Numo::Linalg.dot(vs.transpose,iS)
  p right = Numo::Linalg.dot(uu.transpose,yy)

  Numo::Linalg.dot(left, right)
Numo::DFloat#shape=[3,4]
[[0.0509649, 0, 0, 0],
 [0, 0.584088, 0, 0],
 [0, 0, 3.75583, 0]]
Numo::DFloat#shape=[3,4]
[[-0.00421136, -0.393889, 2.75587, 0],
 [-0.0138812, -0.404752, -2.50719, 0],
 [-0.0488569, 0.14895, 0.474791, 0]]
Numo::DFloat#shape=[4]
[-28.6152, 1.83564, -1.41424, 1.34164]


Numo::DFloat#shape=[3]
[-4.5, 3.2, 1]
係数は,invを使ったのからsvdを使ったのに変えても一致.
実働の確認
元のデータでinvを使ったのをまずは確認.
  x, y=x_vals, y_vals

  # make design matrix
  n = 5 # data
  m = 4 # dimension
  av = Numo::DFloat.zeros(n, m)
  yy = Numo::DFloat.zeros(n)
  n.times do |i|
    m.times do |j|
      av[i,j]=x[i]**j
    end
    yy[i] = y[i]
  end

  # fit by using matrix inv
  require 'numo/linalg'
  ai = Numo::Linalg.inv(Numo::Linalg.dot(av.transpose,av))
  b = Numo::Linalg.dot(av.transpose,yy)
  $vars = Numo::Linalg.dot(ai,b)
  p ['$vars', $vars]

  # block for lazy evaluation in plot_data_and_func
  free_e_plot = lambda { |x| polynomials($vars, x) }

  pl = plot_data_and_func(x, y, free_e_plot)
  pl.show
["$vars", Numo::DFloat#shape=[4]
[-3.64941, -0.000331879, -2.73809e-07, 4.18368e-11]]
  ss, uu, vs =  Numo::Linalg.svd(av)

  iS = Numo::DFloat.zeros(m, n)
  m.times do |j|
      iS[j,j]=1.0/ss[j]
  end
  #p iS
  left = Numo::Linalg.dot(vs.transpose,iS)
  right = Numo::Linalg.dot(uu.transpose,yy)

  p vars = Numo::Linalg.dot(left, right)

  # block for lazy evaluation in plot_data_and_func
  free_e_plot = lambda { |x| polynomials(vars, x) }

  pl = plot_data_and_func(x, y, free_e_plot)
  pl.show
Numo::DFloat#shape=[4]
[-3.65027, -0.000331299, -2.74726e-07, 4.14365e-11]
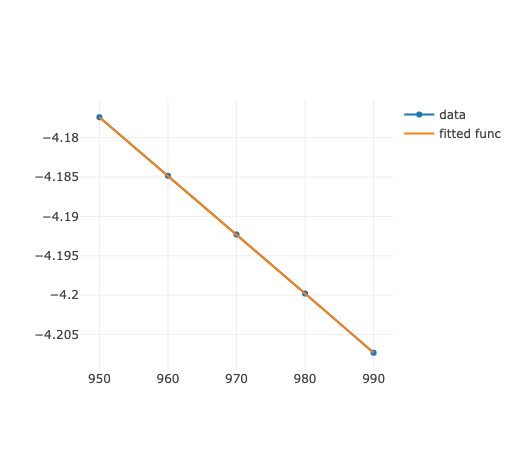
さすが svd.
最終形(完成版fitting_svd)
  require 'numo/gnuplot'
  require 'numo/narray'
  require 'numo/linalg'

  def fitting_svd(x, d_y, dim = 3)
    y = d_y

    # make design matrix
    n, m = x.size, dim
    av = Numo::DFloat.zeros(n, m)
    yy = Numo::DFloat.zeros(n)
    n.times do |i|
      m.times do |j|
        av[i,j]=x[i]**j
      end
      yy[i] = y[i]
    end
    ss, uu, vs =  Numo::Linalg.svd(av)

    iS = Numo::DFloat.zeros(m, n)
    m.times do |j|
      iS[j,j]=1.0/ss[j]
    end
    #p iS
    left = Numo::Linalg.dot(vs.transpose,iS)
    right = Numo::Linalg.dot(uu.transpose,yy)

    return Numo::Linalg.dot(left, right)
  end
:fitting_svd
  p x_vals = [950, 960, 970, 980, 990]
  p y_vals = [-4.177412829697432, -4.1848393364765, -4.192296922237924,
      -4.199785335389045, -4.207304330283102]

  fitting_svd(x_vals, y_vals, 4)
[950, 960, 970, 980, 990]
[-4.177412829697432, -4.1848393364765, -4.192296922237924, -4.199785335389045, -4.207304330283102]


Numo::DFloat#shape=[4]
[-3.65027, -0.000331299, -2.74726e-07, 4.14365e-11]
  vars = fitting_svd(x_vals, y_vals, 4)
  free_e_plot = lambda { |x| polynomials(vars, x) }

  pl = plot_data_and_func(x_vals, y_vals, free_e_plot)
  pl.show
Mapleとの比較(overtaken?!)
得られた結果をMapleの結果と比較すると,
  f1 := x -> 7.526568118*x^3/10^9 +
  (-1)*0.00002204463465*x^2 +
  0.02077149587*x -
  10.46814903

  f2:=unapply(-3.65027
  -0.000331299*x
  -2.74726e-07*x^2
  + 4.14365e-11*x^3, x);

  eV2J:=(1.60218*10**(-19))*(6.0221367*10**(23));
  subs(x=970,-x*diff(f1(x)*eV2J, x,x)); # by Maple fitting
  subs(x=970,-x*diff(f2(x)*eV2J, x,x)); # by Numo::svd
                        eV2J := 96485.46978
                            26.63998203
                            28.85328724
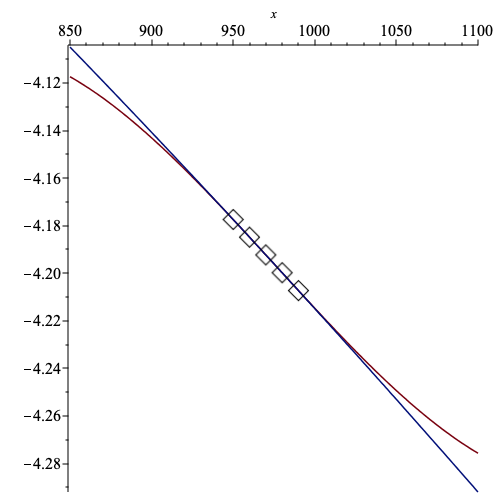
とズレがある.これをより広域のplotで比べると
Fitted free energy by SVD(blue) vs Maple(red).
うーーーん.見た目は Numo::Linalg.svdの勝ちだね.
実際,少しずれた温度(i.e. $T$=980) で$F(T)$を比べるとMapleは全然違う値.
エントロピー($S$)は $$Z = \left(\frac{\exp(-\Theta_E/2T)}{1-\exp(-\Theta_E/T)} \right)^{3N} \S = k_B \ln Z$$ だな.
Qiita記事作成のメモ
fit_plot.ipynbより途中で,qiita_org
> qiita upload fit_plot.org
でfigsを登録したのちに,以下でQiita記事を作成.
  > jupyter nbconvert --to markdown fit_plot.ipynb
  > pandoc -f markdown -t org -o fit_plot.org fit_plot.md
  > rake fit_plot > tmp.org
  > qiita post tmp.org
- source ~/current_research/higher_moment/moment_al/einstein/harmonic_free/tmp.org
