Bollinger Bands are beloved by traders worldwide as statistical indicators for technical analysis, yet many investors haven't fully utilized their true power. Implementing BBTrend (Bollinger Band Trend) analysis using TradingView's Pine Script enables more precise prediction of price movement direction and sustainability in cryptocurrency markets.
Traditional Bollinger Band analysis typically generates buy/sell signals only when prices touch the upper or lower bands. However, BBTrend methodology enables early-stage market trend detection by comprehensively analyzing Bollinger Band shape changes, dynamic band width fluctuations, and the trajectory prices draw within the bands. This innovative approach enables early identification of subtle trend changes that traditional methods couldn't capture, even amid cryptocurrency's characteristic rapid price movements.
BBTrend analysis demonstrates particular effectiveness in major cryptocurrencies like Bitcoin and Ethereum. Cryptocurrency markets operate 24/7/365, have more volatile price movements compared to traditional stock markets, and exhibit high volatility characteristics. In such environments, simple lagging indicators like moving averages or RSI (Relative Strength Index) struggle to respond to rapid market direction changes. BBTrend methodology utilizes Bollinger Bands' statistical characteristics to make predictions considering probabilistic distribution of price movements, achieving more accurate trend determination.
Theoretical Foundation of Bollinger Bands and BBTrend Innovation
Bollinger Bands are technical analysis indicators developed in the 1980s by renowned American analyst John Bollinger. These indicators consist of moving averages as center lines with lines positioned above and below by adding and subtracting standard deviations. Typically, 20-period simple moving averages and 2 standard deviations are used, but optimization with different parameter settings is possible using TradingView's advanced charting features.
The core of BBTrend methodology lies in utilizing Bollinger Bands not merely as support/resistance lines, but as dynamic indicators reflecting market psychology and volatility changes. When prices position in the upper band area, it doesn't simply indicate "overbought" conditions but may suggest bullish trend continuation possibilities. Conversely, when prices position in the lower band area, it doesn't necessarily mean rebound from "oversold" conditions but may represent bearish trend deepening.
Applying this concept to cryptocurrency trading requires considering characteristics different from traditional financial markets. In cryptocurrency markets, news events, regulatory announcements, and large investor movements have extremely large price impacts, causing dramatic short-term price movements. BBTrend analysis doesn't remove such sudden price movements as noise but treats them as important trend formation elements, reading market participant emotional changes from band width expansion and contraction patterns.
Particularly important are Bollinger Band "squeeze" and "expansion" concepts. Squeeze refers to conditions where market volatility decreases and band width narrows, often serving as precursors to large price movements. Conversely, expansion refers to conditions where band width expands due to rapid volatility increases, suggesting strong trend occurrence or continuation. Utilizing TradingView's real-time market data enables more precise detection of these phenomena and improved trend prediction accuracy.
BBTrend Signal Generation Mechanisms and Implementation Strategies
BBTrend signal generation adopts composite approaches integrating multiple elements. Without depending on single indicators, it generates more reliable trend signals by comprehensively evaluating Bollinger Band positional relationships, band width change rates, relative price positions, and volume correlations.
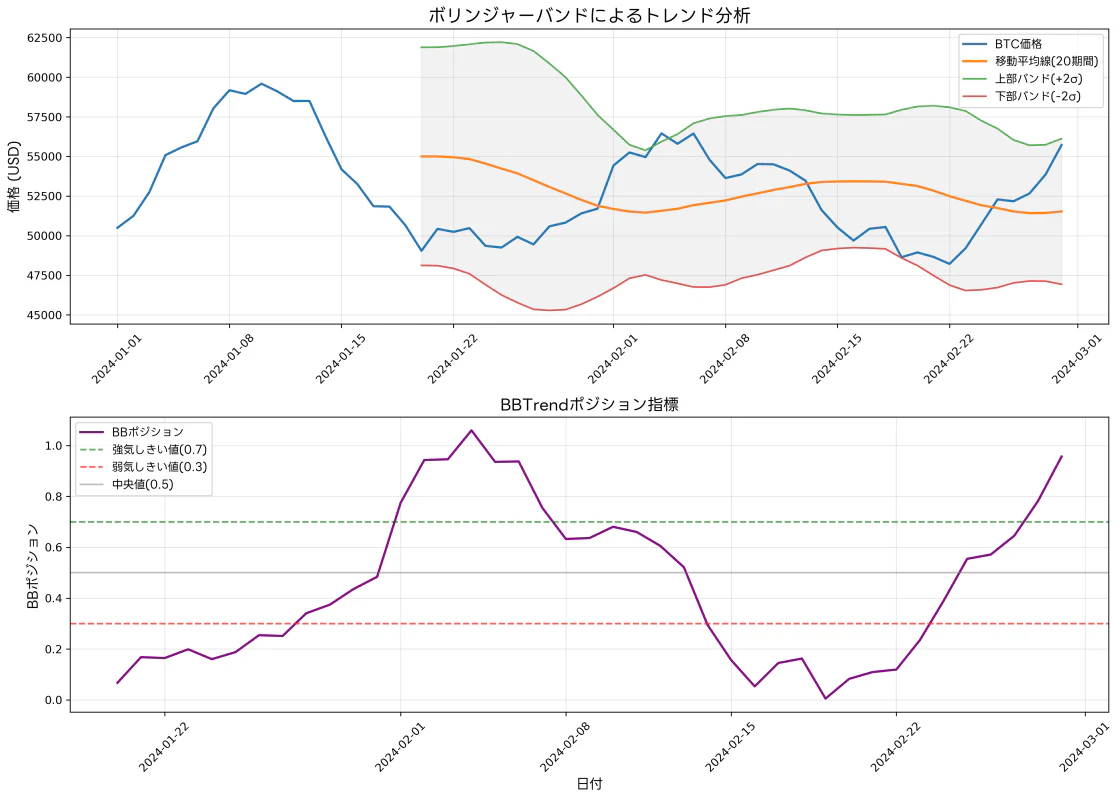
The first element, "band position analysis," quantifies where current prices position within Bollinger Bands. When prices position above the middle line (moving average) and move toward the upper band, this is identified as "uptrend formation period." Similarly, when prices position below the middle line and move toward the lower band, it's classified as "downtrend formation period." This analysis enables grasping basic market direction.
The next important element is "band width dynamics analysis." Band width changes directly reflect market volatility changes, providing extremely important information for predicting trend strength and sustainability. When band width expands rapidly, it suggests strong trend initiation or acceleration, where trend-following strategies often prove effective. Conversely, when band width contracts, it indicates unclear market direction with high possibilities of range markets or correction phases.
The third element, "price trajectory analysis," observes in detail what trajectories prices draw within Bollinger Bands. During uptrends, "band walk" phenomena are often observed where prices trend near upper bands without falling below middle lines. This phenomenon indicates sustained strong buying pressure, suggesting high trend continuation possibilities. Utilizing TradingView's advanced chart analysis features enables more precise identification of such price trajectory patterns.
Volume correlation analysis also plays important roles in BBTrend methodology. When prices break through important Bollinger Band levels with volume increases, breakout reliability improves dramatically. Conversely, breakouts without volume support have high possibilities of becoming "false signals," raising questions about trend sustainability. In cryptocurrency markets where large investor movements significantly impact prices, volume analysis holds particularly important meaning.
//@version=5
indicator("BBTrend Advanced Analysis", shorttitle="BBTrend", overlay=true)

// Bollinger Band settings
bb_length = input.int(20, title="BB Period", minval=1)
bb_mult = input.float(2.0, title="Standard Deviation Multiplier", minval=0.1, step=0.1)

// BBTrend analysis parameters
trend_threshold = input.float(0.6, title="Trend Threshold", minval=0.1, maxval=1.0, step=0.1)
volume_factor = input.float(1.5, title="Volume Confirmation Multiplier", minval=1.0, step=0.1)

// Bollinger Band calculation
basis = ta.sma(close, bb_length)
dev = bb_mult * ta.stdev(close, bb_length)
upper = basis + dev
lower = basis - dev

// BBTrend signal calculation
bb_position = (close - lower) / (upper - lower)
bb_width = (upper - lower) / basis
bb_width_change = ta.change(bb_width, 5)
volume_ratio = volume / ta.sma(volume, 20)

// Trend signals
bullish_trend = bb_position > trend_threshold and bb_width_change > 0 and volume_ratio > volume_factor
bearish_trend = bb_position < (1 - trend_threshold) and bb_width_change > 0 and volume_ratio > volume_factor
Practical Considerations for BBTrend Implementation in Cryptocurrency Markets
Implementing BBTrend methodology in cryptocurrency markets involves special considerations different from traditional financial markets. First, since cryptocurrency markets trade continuously 24 hours, concepts like "opening" and "closing" seen in traditional stock markets don't exist. Due to this characteristic, BBTrend signals also require continuous monitoring, showing very high compatibility with automated algorithmic trading.
Market liquidity also requires important consideration. Major cryptocurrencies like Bitcoin and Ethereum have sufficient liquidity, but some altcoins have limited liquidity. In low-liquidity assets, small trades can significantly impact prices, potentially affecting BBTrend signal reliability. Utilizing TradingView's comprehensive cryptocurrency data enables prior assessment of each asset's liquidity conditions for appropriate asset selection.
In cryptocurrency markets where leveraged trading is common, special attention is needed in BBTrend signal interpretation. In high-leverage trading, even small price movements create large profits/losses, making signal accuracy more important. BBTrend methodology aims to minimize loss risks from false signals by combining multiple confirmation indicators.
Tax considerations are also important implementation elements. Many countries tax cryptocurrency trading profits, so trading frequency and holding periods significantly impact traders' net profits. Since BBTrend methodology primarily focuses on capturing medium to long-term trends, it may offer better tax efficiency compared to short-term scalping methods.
From security perspectives, BBTrend implementation requires special consideration. In cryptocurrency trading, private key management and wallet security are extremely important; when building automated trading systems, architecting with proper consideration of these elements is essential. Utilizing TradingView's secure trading environment can minimize these risks.
Advanced BBTrend Optimization Strategies and Market Adaptability
BBTrend methodology's true value lies in its flexibility for dynamic optimization according to market environment changes. Rather than depending on fixed parameters, more precise trend analysis becomes possible by adjusting Bollinger Band periods and standard deviation multipliers according to market characteristics and volatility changes.
Adaptive parameter adjustment begins by identifying market volatility regimes (high and low volatility periods). During high volatility periods, using larger standard deviation multipliers can reduce false signals from noise. Conversely, during low volatility periods, using smaller standard deviation multipliers enables capturing subtle trend changes.
Timeframe optimization is also an important element. Short-term traders often apply BBTrend on 5-minute or 15-minute charts, but this increases noise susceptibility. Long-term investors can obtain more stable trend signals using daily or weekly charts. Optimal timeframe selection should be determined by investment style, risk tolerance, and market environment.
Multi-timeframe analysis is advanced technology that dramatically improves BBTrend accuracy. For example, approaches are possible where long-term uptrends are confirmed on daily charts, entry timing is refined on 4-hour charts, and specific entry points are determined on 1-hour charts. Utilizing TradingView's multi-timeframe functionality enables efficient execution of such advanced analysis.
Optimization through correlation analysis is also important, particularly in cryptocurrency markets. Considering price correlations between Bitcoin and altcoins, or between cryptocurrency and traditional financial markets, enables more comprehensive market analysis. For example, when Bitcoin shows strong uptrends while specific altcoins haven't yet shown trend reversal signals, those altcoins may suggest possibilities for follow-up rises.
From risk management perspectives, BBTrend methodology requires continuous optimization. Maximum drawdown limits, dynamic position sizing adjustments, and stop-loss rule settings are essential elements for long-term operational success. By adjusting position sizes according to BBTrend signal strength, larger positions can be taken during high-confidence signals while conservative approaches are adopted in high-uncertainty situations.
Building and Managing Practical BBTrend Trading Strategies
Applying BBTrend methodology to actual trading requires not only theoretical understanding but also practical operational know-how acquisition. Building successful trading strategies requires defining entry conditions, setting profit-taking/stop-loss levels, and establishing position management rules.
Entry condition settings minimize losses from false signals by combining multiple confirmation signals. In addition to basic BBTrend signals, volume confirmation, momentum indicator consistency, and relationships with important support/resistance levels are comprehensively evaluated. For example, when prices approach Bollinger Band upper areas with above-average volume and RSI below 70, sustainable uptrend possibilities can be judged as high.
Profit-taking strategies benefit from gradual profit-taking approaches utilizing BBTrend signal characteristics. Initial profit targets are set on opposite sides of Bollinger Bands, then additional profit points are dynamically adjusted according to trend continuation. When strong trends continue, "trailing stops" are used to protect profits while aiming for maximum trend benefits.
Utilizing TradingView's alert functionality enables 24-hour market monitoring automation, minimizing risks of missing important BBTrend signals. Particularly in cryptocurrency markets where important price movements often occur during nights and early mornings, building automated alert systems becomes an important element for trading success.
Portfolio-level operational management is also essential for BBTrend success. When applying BBTrend analysis to multiple cryptocurrency assets, position allocation considering each asset's correlations becomes important. Holding large simultaneous positions in highly correlated assets reduces diversification effects and concentrates risk.
For performance evaluation and continuous improvement, maintaining detailed trading records is necessary. Recording each trade's entry reasons, profit-taking/stop-loss decision rationales, and market environment characteristics enables objective strategy effectiveness evaluation and necessary adjustments. Regular monthly or quarterly reviews are important for long-term strategy improvement.
Important in BBTrend implementation is considering not only mechanical market analysis but also fundamental factors unique to cryptocurrency markets. Regulatory changes, major corporate cryptocurrency adoption news, and central bank digital currency policies can cause price movements difficult to predict through technical analysis. Combining BBTrend signals with fundamental analysis enables more comprehensive investment decisions.
Ultimately, BBTrend success is achieved through combinations of theoretical understanding, practical experience, and continuous learning. Utilizing TradingView's community features for information exchange with other traders and discovering new insights and improvements also contributes importantly to long-term success. Cryptocurrency markets are rapidly evolving fields, and flexibility to adapt to new technologies and market structure changes becomes key to sustainable investment success.

From technical implementation perspectives, conducting backtesting (strategy verification using historical data) is extremely important for confirming strategy effectiveness. Testing BBTrend strategies using several years of cryptocurrency market data enables evaluating strategy performance under various market environments. However, it must always be kept in mind that backtest results don't guarantee future performance.

From risk management perspectives, BBTrend strategies require strict adherence to "money management" principles. Limiting maximum loss per trade to within 1-2% of total capital and pre-establishing response plans for consecutive losses are important. Eliminating emotional judgments and mechanically adhering to rules forms the foundation for long-term investment success.
Disclaimer:
The design, implementation, operation of automated trading systems and related financial transactions are entirely at the user's own discretion and responsibility. The author and publishing platform (Qiita) assume no legal or financial responsibility for any damages or losses arising from these activities.
This article aims to provide information based on the author's technical validation and operational experience with TradingView and Pine Script. While efforts are made to ensure content accuracy and completeness, no guarantee is provided regarding its validity or applicability.
Since market trading inherently involves risk, thorough backtesting and risk evaluation before actual capital investment, and seeking professional advice when necessary, are recommended.
Please fully understand and acknowledge these points before utilizing this article.