個人検証用に、AWS EC2 上の Ubuntu に
Node Exporter + Prometheus + Grafana を使って最小構成のメトリクス監視環境を構築しました。
環境: ubuntu
バージョン情報:
node exporter 1.9.1
prometheus 2.53.4
構築時点: 2025.06中旬
Node Exporter セットアップ
アップデートと必須のツール
sudo apt update && sudo apt upgrade -y
sudo apt install -y wget curl vim tar
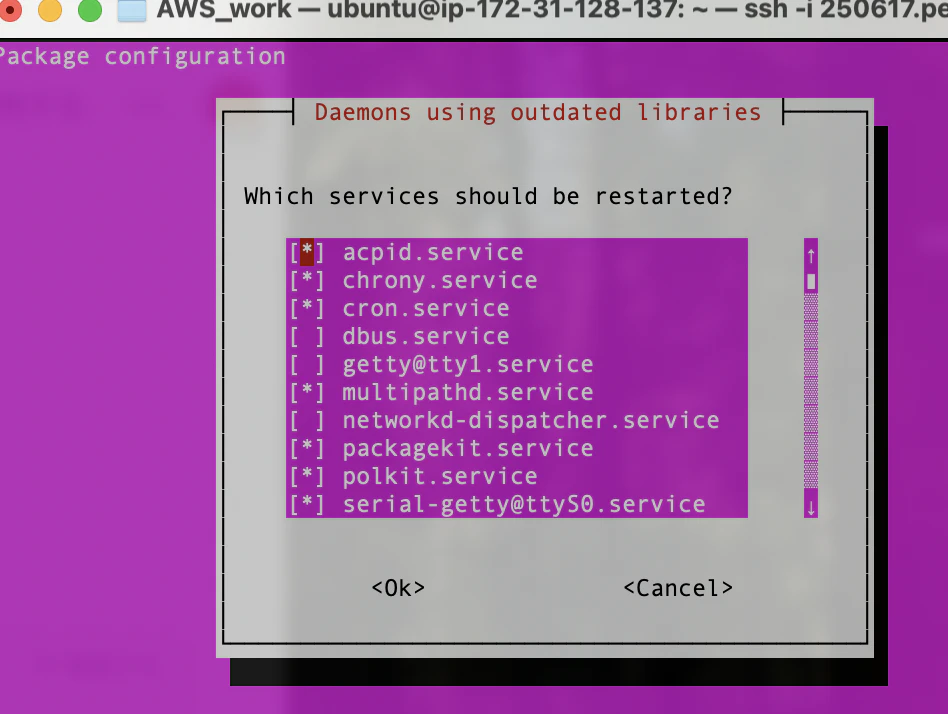
「tab」キーで[ok]ボタンに移動し、押す
ログインパーミッションがないユーザーを用意する
sudo useradd -rs /bin/false node_exporter
ダウンロードと解凍展開
wget https://github.com/prometheus/node_exporter/releases/download/v1.9.1/node_exporter-1.9.1.linux-amd64.tar.gz
tar xvfz node_exporter-1.9.1.linux-amd64.tar.gz
sudo cp node_exporter-1.9.1.linux-amd64/node_exporter /usr/local/bin/
Node Exporter の systemd サービス
sudo tee /etc/systemd/system/node_exporter.service > /dev/null <<EOF
[Unit]
Description=Node Exporter
After=network.target

[Service]
User=node_exporter
ExecStart=/usr/local/bin/node_exporter

[Install]
WantedBy=default.target
EOF
-
systemd は Linux のサービス管理システム。
-
このファイルを /etc/systemd/system/ に配置することで、Node Exporter を Linux の「サービス」として起動・管理できます。
サービスとしてスタートアップを有効化する
sudo systemctl daemon-reexec
sudo systemctl daemon-reload
sudo systemctl start node_exporter
sudo systemctl enable node_exporter
サービスを確認する
sudo systemctl status node_exporter
Windows PC などローカル端末のブラウザから確認する
http://<IP>:9100/metrics
Prometheus セットアップ
ダウンロードと展開する
cd /tmp
wget https://github.com/prometheus/prometheus/releases/download/v2.53.4/prometheus-2.53.4.linux-amd64.tar.gz
tar -xvf prometheus-2.53.4.linux-amd64.tar.gz
cd prometheus-2.53.4.linux-amd64
実行ファイルをシステムに移動する。
設定ファイルとコンソールをコピーする
sudo cp prometheus /usr/local/bin/
sudo cp promtool /usr/local/bin/

sudo mkdir -p /etc/prometheus
sudo cp -r consoles/ console_libraries/ /etc/prometheus/
sudo cp prometheus.yml /etc/prometheus/
Prometheus 設定ファイルを編集:
sudo vim /etc/prometheus/prometheus.yml
global:
  scrape_interval: 15s

scrape_configs:
  - job_name: 'node_exporter'
    static_configs:
      - targets: ['localhost:9100']
-
Prometheus は pull 型の監視:対象に行って「メトリクスちょうだい」と取得する。
-
scrape_interval: 15秒ごとに targets に記載されたアドレス(ここでは localhost:9100)へアクセス。
-
job_name: 識別用ラベル。Grafana でフィルタや条件指定に使えます。
-
targets: node_exporter が動いてるホストとポート。実際のメトリクスは http://localhost:9100/metrics にある。
systemd サービス登録:
sudo tee /etc/systemd/system/prometheus.service > /dev/null <<EOF
[Unit]
Description=Prometheus Monitoring
Wants=network-online.target
After=network-online.target

[Service]
User=nobody
ExecStart=/usr/local/bin/prometheus \
  --config.file=/etc/prometheus/prometheus.yml \
  --storage.tsdb.path=/var/lib/prometheus/ \
  --web.console.templates=/etc/prometheus/consoles \
  --web.console.libraries=/etc/prometheus/console_libraries

[Install]
WantedBy=default.target
EOF
-
Prometheus はコンフィグファイルが必須。
-
--storage.tsdb.path: データを保存するローカルディレクトリ(time series database)。
-
--web.console.templates/libraries: Web UI でのテンプレート参照に使うリソース。
-
ユーザー nobody を使ってる理由:
→ あえて最低限の権限しか持たないユーザーを使い、セキュリティを高めるためです。
データ保存用のディレクトリを作成して、権限設定、サービス化
sudo mkdir /var/lib/prometheus
sudo chown -R nobody:nogroup /var/lib/prometheus /etc/prometheus
sudo systemctl daemon-reload
sudo systemctl start prometheus
sudo systemctl enable prometheus
- Prometheus がメトリクスデータを保存するためのフォルダを作成します。
- Prometheus は nobody ユーザーで動作するため、設定ファイルやデータフォルダの所有者を nobody に変更します。
ローカルPCのブラウザにアクセス
http://<IP>:9090
Grafana セットアップ
# GPG キーの追加(Grafana パッケージの正当性を確認するために必要)
sudo apt install -y software-properties-common
sudo mkdir -p /etc/apt/keyrings
wget -q -O - https://apt.grafana.com/gpg.key | gpg --dearmor | sudo tee /etc/apt/keyrings/grafana.gpg > /dev/null

# Grafana の APT リポジトリを追加
echo "deb [signed-by=/etc/apt/keyrings/grafana.gpg] https://apt.grafana.com stable main" | sudo tee /etc/apt/sources.list.d/grafana.list

# パッケージ情報を更新し、Grafana をインストール
sudo apt update
sudo apt install -y grafana
サービス化
sudo systemctl daemon-reload
sudo systemctl enable grafana-server
sudo systemctl start grafana-server
ローカルpcのブラウザで Grafana にアクセス:
http://<IP>:3000
初期ログイン情報:
user:admin
pass:admin
Prometheus データソースを追加
Data Sources
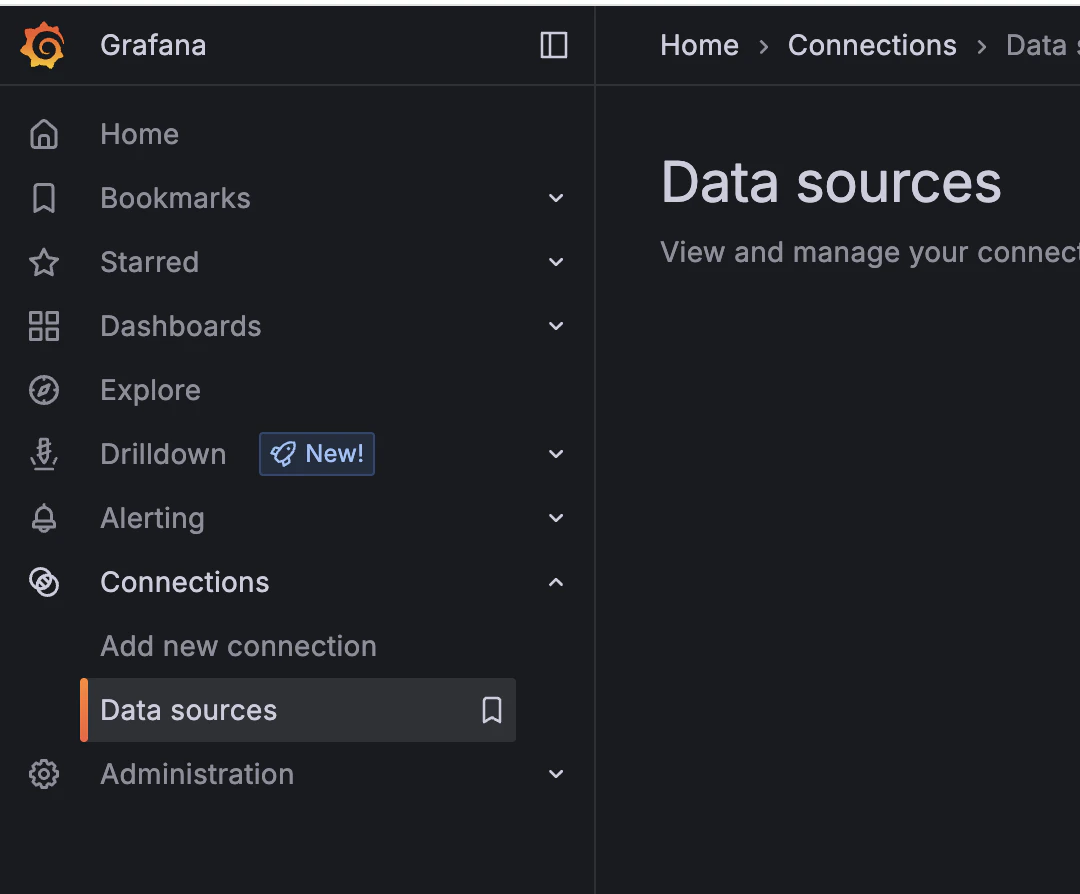
→ 「Add data source」
→ [Prometheus] を選択
http://localhost:9090
→ 「Save & Test」
Node Exporter Dashboard インポート
Grafana 左側メニュー → 📊 Dashboards → Import
→ 「Import via grafana.com」 に以下を入力:
1860
「Load」
→ Prometheus:[Prometheus] を選択
→ 「Import」完了!
テスト用:負荷生成コマンド
CPU やメモリのグラフに変化を与えたい時は以下のツールがおすすめ:
sudo apt install -y stress

# CPU 2コアを20秒間全力稼働させる:
stress --cpu 2 --timeout 10
全体仕組み
┌────────────┐       ┌────────────┐       ┌────────────┐
│  Node      │─────▶│ Prometheus │─────▶│  Grafana   │
│  Exporter  │       │   (Pull)   │       │ (Visualization)
│  (9100)    │       │ (9090)     │       │   (3000)   │
└────────────┘       └────────────┘       └────────────┘