Waymo自動運転データセットを可視化するんだよ!
前回まではこちら
Waymo自動運転車のデータセットを覗いてみた
自動運転データセットを君も可視化してみたくないか?
点群世界、虹の彼方に出かけようぜ!
(アドバイス、ご指摘などあればウェルカム!)
この記事ですること
- Waymo Open Dataset(以下WOD)の可視化ウォークスルー
- 1フレーム/全フレームの読み込み
- 各種センサパラメータの取得
- カメラ画像
- LIDARの距離画像
- カメラ画像へLIDAR点群を投影
- 1フレーム/全フレームの読み込み
※基本的にgoogle colab上のコードを少し改変しながら解説していきます。
WOD可視化ウォークスルー
環境
- Ubuntu 18.04 LTS, i7-9700K, RTX2080
- Python 3.6.8
- Tensorflow-gpu 1.13.1 (tensorflow cpuはなし)
- Nvidia-driver 410.104
- CUDA 10.0
- Cudnn7.4.1
- conda4.6.14(JupyterNotebook環境含む)
今回は上記環境で、Jupyter-Notebookを使って可視化してみよう!
ステップ1: 前準備
- データブラウジングチュートリアルのダウンロード
- 必要なファイルをGoogle Colabからダウンロード
上記Google Colab上にて、セルを作成、下記のコードで必要なファイル3つをダウンロード。(要google chrome)
from google.colab import files
files.download('/content/waymo-od/bazel-genfiles/waymo_open_dataset/label_pb2.py')
files.download('/content/waymo-od/bazel-genfiles/waymo_open_dataset/dataset_pb2.py')
files.download('/content/waymo-od/tutorial/frames')
- Waymo Open Dataset Githubrepoのクイックスタートガイドに従う
前回の記事見てね
- Waymo Open Datasetのダウンロード
オープンデータセットを読み込みたい場合は下記からダウンロード
試しにtraining_0000.tarをダウンロード、解凍する
フォルダの中身は.tfrecordファイル
下準備も終わったことなので、jupyter notebookのセルを1個1個叩いていきましょ
ステップ2: 環境のインポート
import os
import imp
import tensorflow as tf
import math
import numpy as np
import itertools

os.environ['PYTHONPATH']='/env/python:ここにWODrepoのローカルアドレス'
m=imp.find_module('waymo_open_dataset', ['ここにWODrepoのローカルアドレス'])
imp.load_module('waymo_open_dataset', m[0], m[1], m[2])

from waymo_open_dataset.utils import range_image_utils
from waymo_open_dataset.utils import transform_utils
from waymo_open_dataset import dataset_pb2 as open_dataset

tf.enable_eager_execution()
ポイントは
tf.enable_eager_execution()
これによって、sess.runを行わなくてもtensorの計算をしてくれる便利機能(tf2.0ではこれがデフォ)
ステップ3: オープンデータセットの読み込み
FILENAMEの値を、ダウンロードしたデータセットのtfrecordに設定。
試しに一つの.tfrecordを読んでみる
下記は1フレームだけ読み込む
FILENAME = '/データのおいてあるパス/training_0000/segment-1208303279778032257_1360_000_1380_000_with_camera_labels.tfrecord'
dataset = tf.data.TFRecordDataset(FILENAME)
for data in dataset:
    frame = open_dataset.Frame()
    frame.ParseFromString(bytearray(data.numpy()))
    break
すべて読み込みたいなら
dataset = tf.data.TFRecordDataset(FILENAME)
frames = []
for data in dataset:
    frame = open_dataset.Frame()
    frame.ParseFromString(bytearray(data.numpy()))
    frames.append(frame)
    #break

len(frames)
今回使ったファイルには、198フレームが。
10Hzで収集しているので、19.8秒のデータのようです。
複数フレーム読む場合はみたいフレームを指定。
frame = frames[0]
frameオブジェクトのメンバには
- camera_labels: 1フレームに0~4の5台分のカメラで検出された物体の画像座標、サイズ、種別等
- context: カメラとLIDARの内パラ、外パラ, beam inclinationの値
- images: 画像
- laser_labels: LIDAR座標系上のXYZ座標、サイズ、進行方向、物体種別
- lasers: 点群
- no_label_zones: タグ付けをしない領域の設定(詳細はドキュメント参照)
- pose: 車両の姿勢?位置?
- projected_lidar_labels: LIDARで検出した物体を画像に投影したときの画像座標
- timestamp_micros: タイムスタンプ、ドキュメントによればUnix時間(なぜか2027年とかになってた)
等が含まれている。
各パラメータの詳細はこちらを参照
パラメータ詳細
ステップ4:フレームデータをparse
次は1フレームを読み込んで下記の3つを出力する関数
- range_images
- camera_projections
- range_image_top_pose
def parse_range_image_and_camera_projection(frame):
  """Parse range images and camera projections given a frame.

  Args:
     frame: open dataset frame proto
  Returns:
     range_images: A dict of {laser_name,
       [range_image_first_return, range_image_second_return]}.
     camera_projections: A dict of {laser_name,
       [camera_projection_from_first_return,
        camera_projection_from_second_return]}.
    range_image_top_pose: range image pixel pose for top lidar.
  """
  range_images = {}
  camera_projections = {}
  range_image_top_pose = None
  for laser in frame.lasers:
    if len(laser.ri_return1.range_image_compressed) > 0:
      range_image_str_tensor = tf.decode_compressed(
          laser.ri_return1.range_image_compressed, 'ZLIB')
      ri = open_dataset.MatrixFloat()
      ri.ParseFromString(bytearray(range_image_str_tensor.numpy()))
      range_images[laser.name] = [ri]

      if laser.name == open_dataset.LaserName.TOP:
        range_image_top_pose_str_tensor = tf.decode_compressed(
            laser.ri_return1.range_image_pose_compressed, 'ZLIB')
        range_image_top_pose = open_dataset.MatrixFloat()
        range_image_top_pose.ParseFromString(
            bytearray(range_image_top_pose_str_tensor.numpy()))

      camera_projection_str_tensor = tf.decode_compressed(
          laser.ri_return1.camera_projection_compressed, 'ZLIB')
      cp = open_dataset.MatrixInt32()
      cp.ParseFromString(bytearray(camera_projection_str_tensor.numpy()))
      camera_projections[laser.name] = [cp]
    if len(laser.ri_return2.range_image_compressed) > 0:
      range_image_str_tensor = tf.decode_compressed(
          laser.ri_return2.range_image_compressed, 'ZLIB')
      ri = open_dataset.MatrixFloat()
      ri.ParseFromString(bytearray(range_image_str_tensor.numpy()))
      range_images[laser.name].append(ri)

      camera_projection_str_tensor = tf.decode_compressed(
          laser.ri_return2.camera_projection_compressed, 'ZLIB')
      cp = open_dataset.MatrixInt32()
      cp.ParseFromString(bytearray(camera_projection_str_tensor.numpy()))
      camera_projections[laser.name].append(cp)
  return range_images, camera_projections, range_image_top_pose

(range_images, camera_projections,range_image_top_pose) = parse_range_image_and_camera_projection(frame)
ステップ5:画像の表示
import matplotlib.pyplot as plt
plt.figure(figsize=(25, 20))

def image_show(data, name, layout, cmap=None):
  """Show an image."""
  plt.subplot(*layout)
  plt.imshow(tf.image.decode_jpeg(data), cmap=cmap)
  plt.title(name)
  plt.grid(False)
  plt.axis('off')

for index, image in enumerate(frame.images):
  image_show(image.image, open_dataset.CameraName.Name.Name(image.name),
             [3, 3, index+1])
どうやら画像もtfフォーマットで入っているらしく
tf.image.decode_jpegというメソッドを使わないと見ることが出来ない。
カメラIDとセンサ位置は下記の通り
-
実行結果
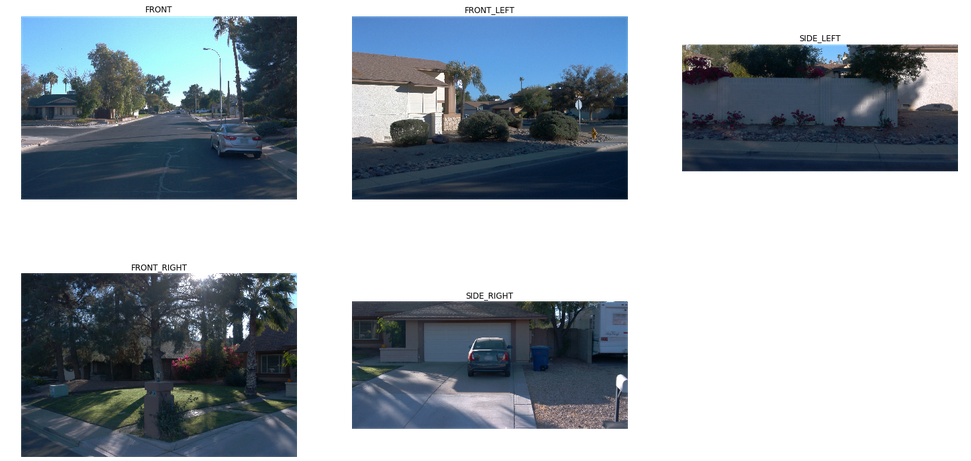
カリフォルニア州の田舎でしょうか?
陰影が強くついているので、画像認識としては難しそうですね。
こういうデータをワンサカ持って学習しているwaymoは強いわけだ。
ステップ6:LIDAR画像の表示
次は、点群をセンサ光軸からの主観視点に置き換えて画像として表示します。
データセットのLIDARの仕様として
- 中距離LIDAR x1は75m以内のデータのみ
- 短距離LIDAR x4は20m以内のデータのみ
- エコーは最も反射強度の強い2つのみを記録
Waymoの使っているLIDARの遠距離パフォーマンスはわからないってことか、残念無念
plt.figure(figsize=(64, 20))
def plot_range_image_helper(data, name, layout, vmin = 0, vmax=1, cmap='gray'):
  """Plots range image.

  Args:
    data: range image data
    name: the image title
    layout: plt layout
    vmin: minimum value of the passed data
    vmax: maximum value of the passed data
    cmap: color map
  """
  plt.subplot(*layout)
  plt.imshow(data, cmap=cmap, vmin=vmin, vmax=vmax)
  plt.title(name)
  plt.grid(False)
  plt.axis('off')

def get_range_image(laser_name, return_index):
  """Returns range image given a laser name and its return index."""
  return range_images[laser_name][return_index]

def show_range_image(range_image, layout_index_start = 1):
  """Shows range image.

  Args:
    range_image: the range image data from a given lidar of type MatrixFloat.
    layout_index_start: layout offset
  """
  range_image_tensor = tf.convert_to_tensor(range_image.data)
  range_image_tensor = tf.reshape(range_image_tensor, range_image.shape.dims)
  lidar_image_mask = tf.greater_equal(range_image_tensor, 0)
  range_image_tensor = tf.where(lidar_image_mask, range_image_tensor,
                                tf.ones_like(range_image_tensor) * 1e10)
  range_image_range = range_image_tensor[...,0]
  range_image_intensity = range_image_tensor[...,1]
  range_image_elongation = range_image_tensor[...,2]
  plot_range_image_helper(range_image_range.numpy(), 'range',
                   [8, 1, layout_index_start], vmax=75, cmap='gray')
  plot_range_image_helper(range_image_intensity.numpy(), 'intensity',
                   [8, 1, layout_index_start + 1], vmax=1.5, cmap='gray')
  plot_range_image_helper(range_image_elongation.numpy(), 'elongation',
                   [8, 1, layout_index_start + 2], vmax=1.5, cmap='gray')

frame.lasers.sort(key=lambda laser: laser.name)
show_range_image(get_range_image(open_dataset.LaserName.TOP, 0), 1)
show_range_image(get_range_image(open_dataset.LaserName.TOP, 1), 4)
show_range_imageはget_range_imageを入力としていて
get_range_image(open_dataset.LaseName.TOP, 表示モード), 表示するLIDAR番号)が引数になっています。
結果は下記。
- range: 距離画像。センサと物体との距離が長いほど白い。
- intensity: 反射強度画像。レーザーに当てられた物体の反射が強いほど白い。
- elongation: LIDARパルスの通常の波長よりもどれくらい伸びたかを表現。汚れなどがあると波長が伸びるらしい。
※elongationは一体なんだろう...自信ないのでどなたか教えてください。以下原文
"Lidar elongation refers to the elongation of the pulse beyond its nominal width. Returns with long pulse elongation, for example, indicate that the laser reflection is potentially smeared or refracted, such that the return pulse is elongated in time."
- 実行結果
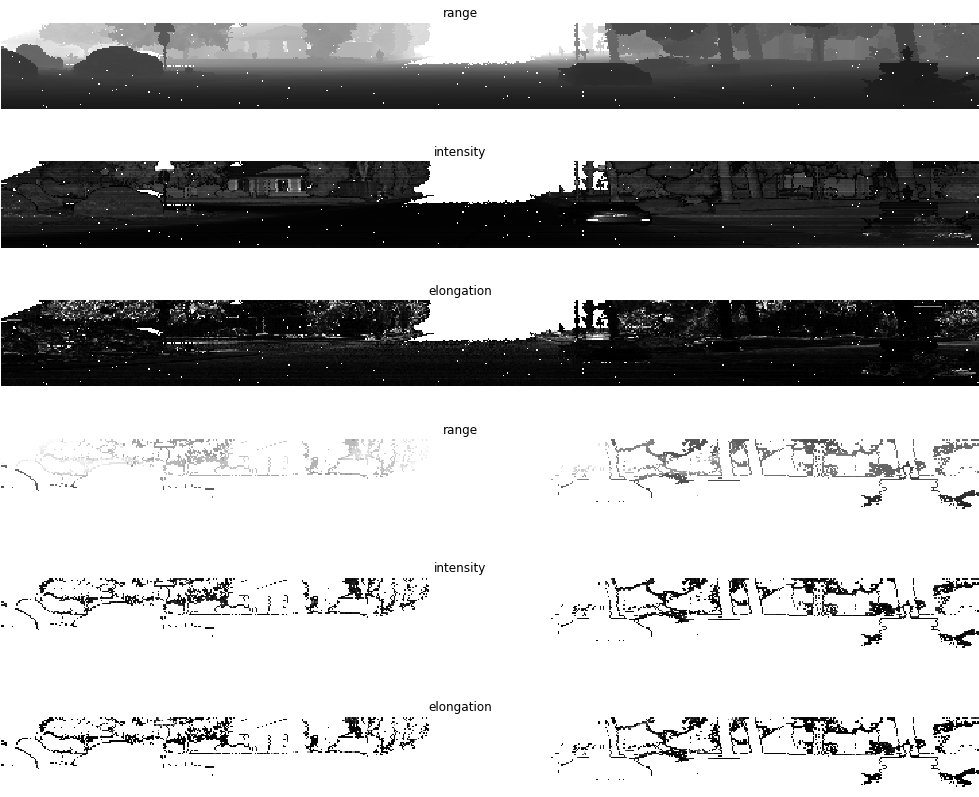
これらの画像を使って認識することもできるんでしょうか?
白いドットはノイズだと思いますがどんな原理で起きているんだろうか。
elongationの使いみちがかなり気になります。
ステップ7:点群の表示
まずは点群画像から点群へ変換
データセットでは、LIDAR極座標系で保存されているらしく
チュートリアルでは極座標系→点群画像(ステップ5の画像)→3D点群に変換しているようです。
ステップ4で取得した、range_images, camera_projections, range_image_top_poseを引数にして3Dの点群をreturnします。
def convert_range_image_to_point_cloud(frame,
                                       range_images,
                                       camera_projections,
                                       range_image_top_pose,
                                       ri_index = 0):
  """Convert range images to point cloud.

  Args:
    frame: open dataset frame
     range_images: A dict of {laser_name,
       [range_image_first_return, range_image_second_return]}.
     camera_projections: A dict of {laser_name,
       [camera_projection_from_first_return,
        camera_projection_from_second_return]}.
    range_image_top_pose: range image pixel pose for top lidar.
    ri_index: 0 for the first return, 1 for the second return.
  Returns:
    points: {[N, 3]} list of 3d lidar points of length 5 (number of lidars).
    cp_points: {[N, 6]} list of camera projections of length 5
      (number of lidars).
  """

  calibrations = sorted(frame.context.laser_calibrations, key=lambda c: c.name)
  lasers = sorted(frame.lasers, key=lambda laser: laser.name)
  points = []
  cp_points = []

  frame_pose = tf.convert_to_tensor(
      np.reshape(np.array(frame.pose.transform), [4, 4]))
  # [H, W, 6]
  range_image_top_pose_tensor = tf.reshape(
      tf.convert_to_tensor(range_image_top_pose.data),
      range_image_top_pose.shape.dims)
  # [H, W, 3, 3]
  range_image_top_pose_tensor_rotation = transform_utils.get_rotation_matrix(
      range_image_top_pose_tensor[..., 0], range_image_top_pose_tensor[..., 1],
      range_image_top_pose_tensor[..., 2])
  range_image_top_pose_tensor_translation = range_image_top_pose_tensor[..., 3:]
  range_image_top_pose_tensor = transform_utils.get_transform(
      range_image_top_pose_tensor_rotation,
      range_image_top_pose_tensor_translation)
  for c in calibrations:
    range_image = range_images[c.name][ri_index]
    if len(c.beam_inclinations) == 0:
      beam_inclinations = range_image_utils.compute_inclination(
          tf.constant([c.beam_inclination_min, c.beam_inclination_max]),
          height=range_image.shape.dims[0])
    else:
      beam_inclinations = tf.constant(c.beam_inclinations)

    beam_inclinations = tf.reverse(beam_inclinations, axis=[-1])
    extrinsic = np.reshape(np.array(c.extrinsic.transform), [4, 4])

    range_image_tensor = tf.reshape(
        tf.convert_to_tensor(range_image.data), range_image.shape.dims)
    pixel_pose_local = None
    frame_pose_local = None
    if c.name == open_dataset.LaserName.TOP:
      pixel_pose_local = range_image_top_pose_tensor
      pixel_pose_local = tf.expand_dims(pixel_pose_local, axis=0)
      frame_pose_local = tf.expand_dims(frame_pose, axis=0)
    range_image_mask = range_image_tensor[..., 0] > 0
    range_image_cartesian = range_image_utils.extract_point_cloud_from_range_image(
        tf.expand_dims(range_image_tensor[..., 0], axis=0),
        tf.expand_dims(extrinsic, axis=0),
        tf.expand_dims(tf.convert_to_tensor(beam_inclinations), axis=0),
        pixel_pose=pixel_pose_local,
        frame_pose=frame_pose_local)

    range_image_cartesian = tf.squeeze(range_image_cartesian, axis=0)
    points_tensor = tf.gather_nd(range_image_cartesian,
                                 tf.where(range_image_mask))

    cp = camera_projections[c.name][0]
    cp_tensor = tf.reshape(tf.convert_to_tensor(cp.data), cp.shape.dims)
    cp_points_tensor = tf.gather_nd(cp_tensor, tf.where(range_image_mask))
    points.append(points_tensor.numpy())
    cp_points.append(cp_points_tensor.numpy())

  return points, cp_points

points, cp_points = convert_range_image_to_point_cloud(frame,
                                                       range_images,
                                                       camera_projections,
                                                       range_image_top_pose)
points_ri2, cp_points_ri2 = convert_range_image_to_point_cloud(
    frame,
    range_images,
    camera_projections,
    range_image_top_pose,
    ri_index=1)

# 3d points in vehicle frame.
points_all = np.concatenate(points, axis=0)
points_all_ri2 = np.concatenate(points_ri2, axis=0)
# camera projection corresponding to each point.
cp_points_all = np.concatenate(cp_points, axis=0)
cp_points_all_ri2 = np.concatenate(cp_points_ri2, axis=0)
取得したpointsは5個の要素があり、(LIDARの数)
一つの要素に該当LIDARが収集した点群のXYZ座標が入っている。(おそらく車両座標系)
5つのLIDARのすべてを合体させたのがpoints_all
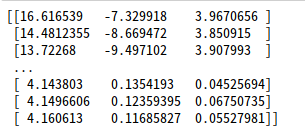
中身の見た目は↑な感じ。
parseするときはこの配列を保存して、pptkやらPCLで表示すれば自分でも使えそう。
XYZだけではなく、XYZIが欲しくなったらちょっと工夫が必要ですね。
点群のイメージ
- Show Point Cloud
※まだ実装されていないので予告、らしい(GoogleColabより)
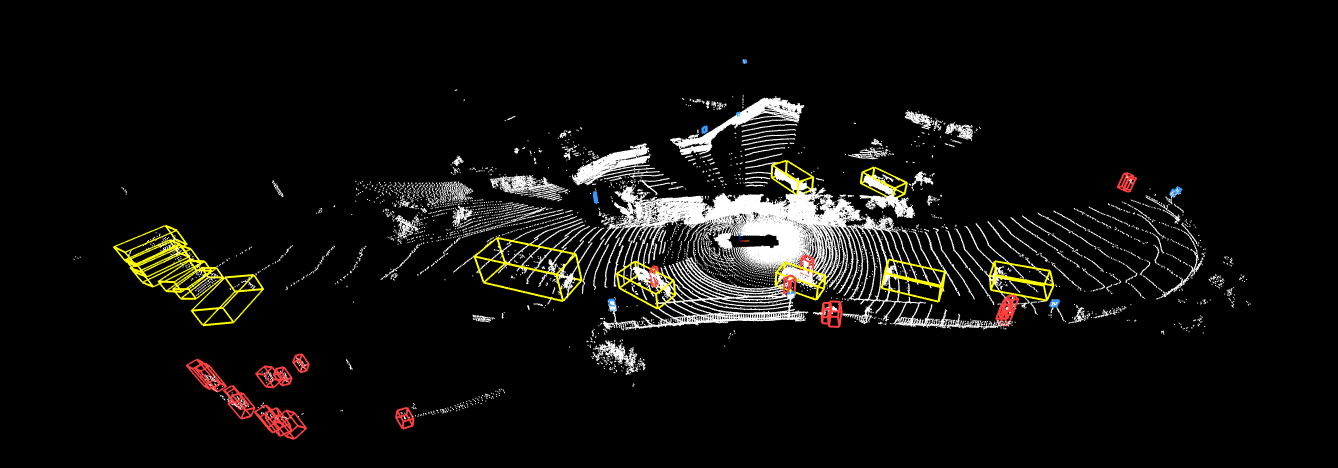
今後PointCloudを3Dで表示、かつ物票もつけてくれるメソッドを作ってくれるらしい
ステップ8:点群をカメラ画像に投影
まずは3D点群データをプロジェクションする処理
images = sorted(frame.images, key=lambda i:i.name)
cp_points_all_concat = np.concatenate([cp_points_all, points_all], axis=-1)
cp_points_all_concat_tensor = tf.constant(cp_points_all_concat)

# The distance between lidar points and vehicle frame origin.
points_all_tensor = tf.norm(points_all, axis=-1, keepdims=True)
cp_points_all_tensor = tf.constant(cp_points_all, dtype=tf.int32)

mask = tf.equal(cp_points_all_tensor[..., 0], images[0].name)

cp_points_all_tensor = tf.cast(tf.gather_nd(
    cp_points_all_tensor, tf.where(mask)), dtype=tf.float32)
points_all_tensor = tf.gather_nd(points_all_tensor, tf.where(mask))

projected_points_all_from_raw_data = tf.concat(
    [cp_points_all_tensor[..., 1:3], points_all_tensor], axis=-1).numpy()
重畳するためのメソッド定義
def rgba(r):
  """Generates a color based on range.

  Args:
    r: the range value of a given point.
  Returns:
    The color for a given range
  """
  c = plt.get_cmap('jet')((r % 20.0) / 20.0)
  c = list(c)
  c[-1] = 0.5  # alpha
  return c

def plot_image(camera_image):
  """Plot a cmaera image."""
  plt.figure(figsize=(20, 12))
  plt.imshow(tf.image.decode_jpeg(camera_image.image))
  plt.grid("off")

def plot_points_on_image(projected_points, camera_image, rgba_func,
                         point_size=5.0):
  """Plots points on a camera image.

  Args:
    projected_points: [N, 3] numpy array. The inner dims are
      [camera_x, camera_y, range].
    camera_image: jpeg encoded camera image.
    rgba_func: a function that generates a color from a range value.
    point_size: the point size.

  """
  plot_image(camera_image)

  xs = []
  ys = []
  colors = []

  for point in projected_points:
    xs.append(point[0])  # width, col
    ys.append(point[1])  # height, row
    colors.append(rgba_func(point[2]))

  plt.scatter(xs, ys, c=colors, s=point_size, edgecolors="none")
プロットする
plot_points_on_image(projected_points_all_from_raw_data,
                     images[0], rgba, point_size=5.0)
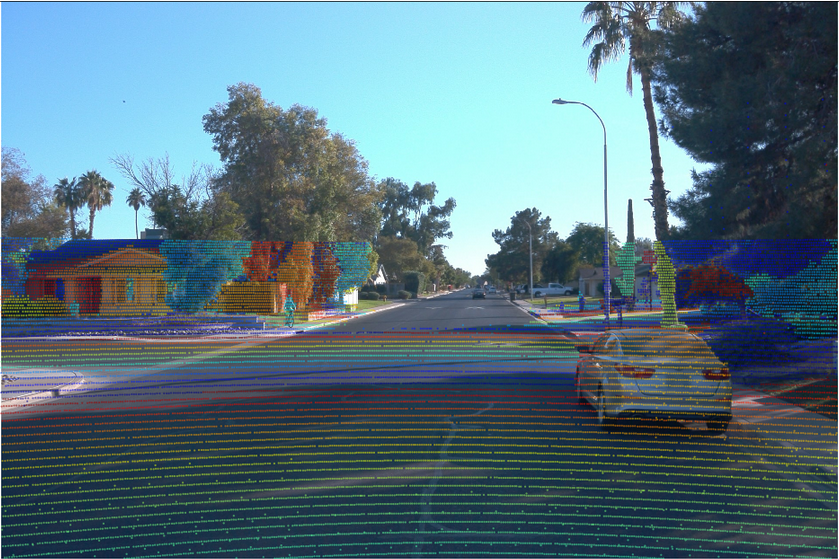
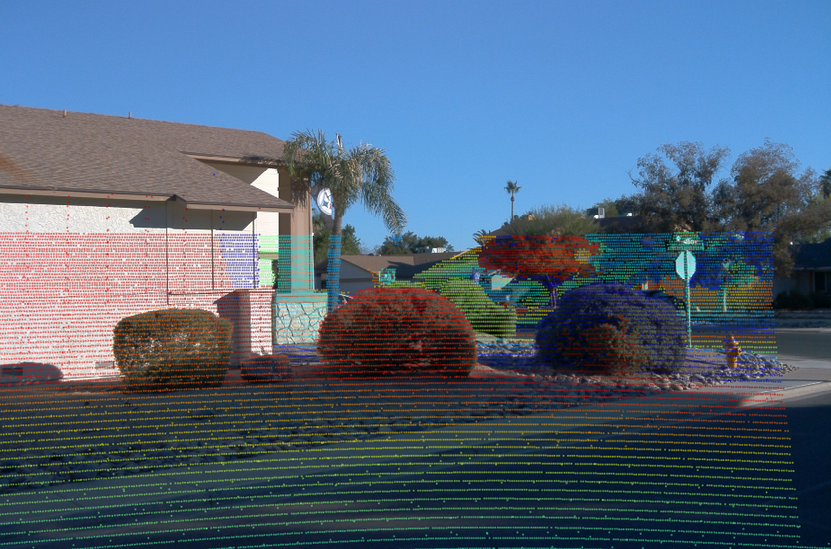
- Visualize Camera Projection
LIDARの点群を画像に重畳。
点群のカラーは20mごとにRGBが繰り返すような書き方ですね。
画像とLIDARのセンサフュージョンを考えると
LIDAR画像座標系と、LIDARの車両座標系が対応して保存されているので
変換に手間取ったりしなくていいのが、便利ですね。
また、プロジェクションを見る限り、カメラとLIDARのキャリブレーションが正確にされているように見えます。
(複数フレーム見ないといけませんが)
この画像では近傍の車はもちろん、遠方のサイクリスト、遠方の木までしっかり点と画像が重畳されています。
Waymoのキャリブレーション技術がきになりますね。
また、LIDARの第一エコーと第2エコーの点をすべて移しているので非常に密な点群に見えるのも特徴です。
彼らが使っているのはHoneyCombなのか、有名所のVelodyneなのかも気になりますね。
誰か、点群鑑定士はいませんかーっ!
さらに、重畳するimage番号を変更すれば、他のカメラに重畳した点群をみることができます。
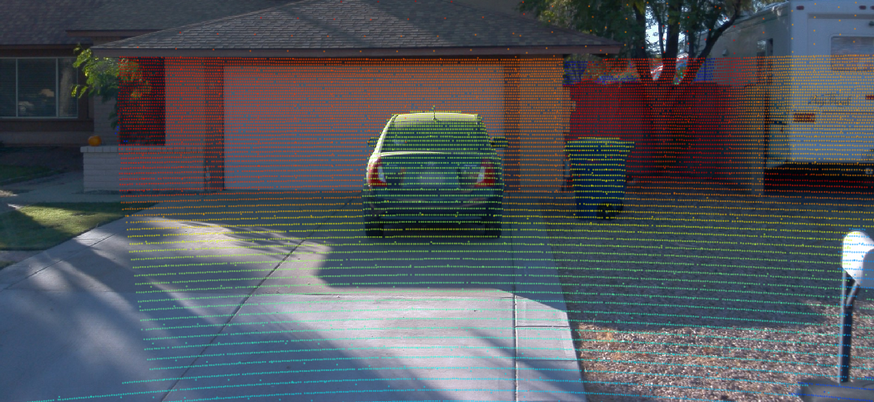
LIDARが画像の端で切れてしまっていますね。
単純なセンサ死角なのか、データとしてクロッピングしているのか、描画コードの問題なのかは不明。
おわりに
以上がWaymo Datasetのビジュアライゼーションウォークスルーです。
こうやって見てみると、彼らのキャリブレーション技術の高さがわかりますね。
これでようやく、画像、点群、LIDAR画像、LIDAR投影ONカメラのデータを取得することができたぞ!
次にやるのはこれを自動でパースしてtfrecord経由せずに使えるようになったらいいな(誰か作って)
それとラベルデータのビジュアライゼーションもできるようになるといいよね、だれk(
ともあれこれからrepoも活発していくと思うので、今後も気分が向いたら更新していきます。
気に入ってくれたらLike, フォロー等お願いします!
それでは〜