LoginSignup
29
28

More than 5 years have passed since last update.

python-louvainでクラスタリング

Last updated at Posted at 2016-06-13

louvainアルゴリズムでクラスタリング

クラスタリングアルゴリズムで分割するコミュニティ数がわかっていない時にModularity "Q"を最大化する手法として,Girvan-Newmanアルゴリズムを始めとした手法がある.クラスタリングについてはNewman アルゴリズムによるソーシャルグラフのクラスタリング - slideshareがわかりやすい.

その中でも現在計算量が比較的少なくなるアルゴリズムとしてlouvainアルゴリズムがある.

論文はこちら
Blondel, Vincent D., et al. "Fast unfolding of communities in large networks." Journal of statistical mechanics: theory and experiment 2008.10 (2008): P10008.

louvainアルゴリズムのpythonでのライブラリpython-louvainを使い、networkxのグラフをクラスタリングをする.

インストール

自分の環境(Python 2.7.10、pip 8.1.2)ではpipでインストールできた.

pip-install
sudo pip install python-louvain

または
ソースコードをダウンロードして

install
python setup.py install

ライブラリのインポートは

import
import community

で行える

クラスタリング

今回は以前の記事で作成したインディーズアーティストのグラフで,クラスタリングを実施する.簡易化のために2015年のデータを対象とした.ノード数は8523個,エッジ本数は61619本で重み付き無向グラフである.詳しいクラスタ分析はしていないので,何でクラスタが構成されているかは把握されていないため,louvainアルゴリズムによって最適なクラスタ数を求めながらクラスタリングするのに最適であると思われる.

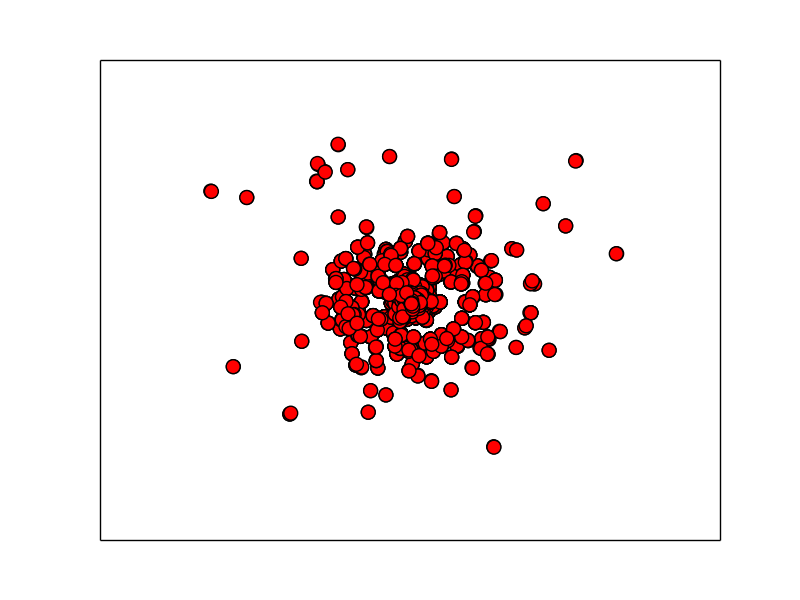
グラフをそのままplotすると以下のグラフになる.
nomal.png

python-louvainの基本的なクラスタリングの計算はcommunity.best_partition(nxGraph)で行える.以下のようなdict形式で返ってくる.

In [1]: community.best_partition(G)                                          
Out[1]: 
{'nodelabel': int(community),
'nodelabel': int(community),
...

グラフをクラスタリングしてplotしてみる.サンプルを参考にplotする関数を作成.

clustering.py
import networkx as nx
import community
def clusteringplot(G):
  partition = community.best_partition(G)                                                                                                           
  size = float(len(set(partition.values())))                                                                                                 
  pos = nx.spring_layout(G)                                                                                                                  
  count = 0.                                                                                                                                 
  for com in set(partition.values()):                                                                                                        
    count += 1.                                                                                                                              
    list_nodes = [nodes for nodes in partition.keys() if partition[nodes] == com]                                                            
    nx.draw_networkx_nodes(G, pos, list_nodes, node_size=150, node_color = str(count/size))                                                                                                                                 
  plt.show()

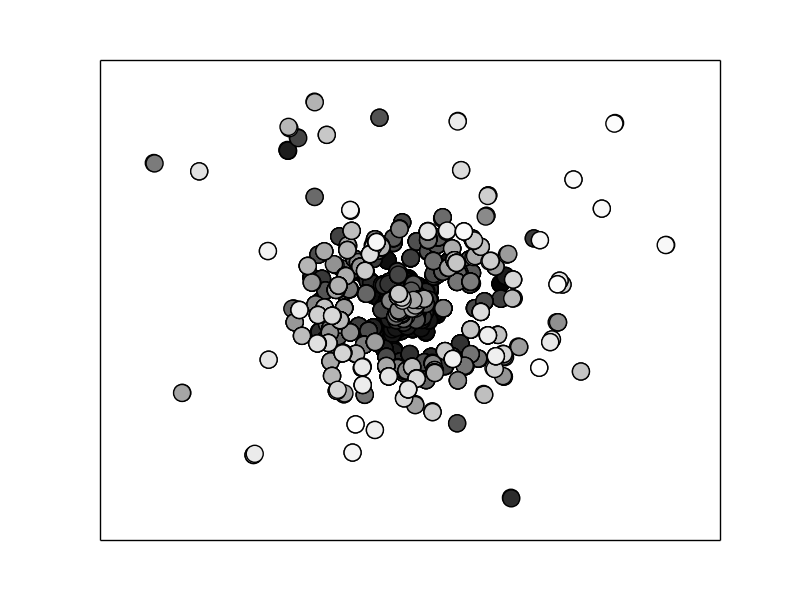
出力されたグラフは以下.クラスタ別に色をつけている.
cluserring.png

クラスタリングその後

ここで述べられているようにクラスタリングとはある種の恣意的なものであり,重要なのはそのクラスタが何で構成されているかの意味づけであるのは間違いない.louvainアルゴリズムによってクラスタ数および構成を明らかにした後は,その構成要素の分析をし,その意味づけをしていくことを忘れてはならない.

参考

PythonとCytoScapeを使ってクラスタリングと可視化 - Qiita

29
28
0

Register as a new user and use Qiita more conveniently

  1. You get articles that match your needs
  2. You can efficiently read back useful information
  3. You can use dark theme
What you can do with signing up
29
28