はじめに
日本分類学会の学会誌「データ分析の理論と応用」のVol.5 (2016)に載っていた、"対応分析を用いたアソシエーションルールによるアンケート結果の可視化" についてアンケート以外にも使えるんじゃないか?と思ってPythonで実施してみた、という話。
networkxの練習も兼ねている。
書きなぐったようなクソコードをさらしていくスタイル。
ざっくり内容説明
当該論文について、簡単に説明すると、コレスポンデンス分析の結果のプロット上に、アソシエーション分析の結果の組み合わせ同士を線で繋げてあげるイメージ。論文中では"属性特化型特徴抽出アソシエーションプロット"と呼ばれている。
論文中の例として、メディア層(属性)別の健康上の悩みアンケート結果に対して可視化を行っている。
可視化の結果、例えば「F3層は○○の悩みがある傾向で、一方F1層・F2層は××の悩みがある傾向だが、~~の悩みに関してはF2層F3層共通の悩みである」といったことがわかる。

POSデータへの適用
例えばID-POSデータを使って属性に当たる部分を地域や店舗、アンケートに当たる部分を購入商品カテゴリーやブランドの購入回数とすると、地域や店舗の購買傾向を可視化することができる。
実際に、計算機統計学 29巻 22号 の"売り上げ傾向による店舗の分類と購買傾向の分析と可視化"では店舗別の購買傾向について分析を行っている。
今回の試みも、POSデータに対して実施した。
使用データ
kaggleのsuperstore_dataを使う。
4年間のグローバルスーパーストアの小売データで、Customer IDやProduct ID、Cityなどがあるが、店舗IDのようなものは無い。
店舗IDが無いので、今回は国と、商品サブカテゴリーの購買傾向を可視化する。
<class 'pandas.core.frame.DataFrame'>
RangeIndex: 51290 entries, 0 to 51289
Data columns (total 24 columns):
 #   Column          Non-Null Count  Dtype
---  ------          --------------  -----
 0   Row ID          51290 non-null  int64
 1   Order ID        51290 non-null  object
 2   Order Date      51290 non-null  datetime64[ns]
 3   Ship Date       51290 non-null  datetime64[ns]
 4   Ship Mode       51290 non-null  object
 5   Customer ID     51290 non-null  object
 6   Customer Name   51290 non-null  object
 7   Segment         51290 non-null  object
 8   City            51290 non-null  object
 9   State           51290 non-null  object
 10  Country         51290 non-null  object
 11  Postal Code     9994 non-null   float64
 12  Market          51290 non-null  object
 13  Region          51290 non-null  object
 14  Product ID      51290 non-null  object
 15  Category        51290 non-null  object
 16  Sub-Category    51290 non-null  object
 17  Product Name    51290 non-null  object
 18  Sales           51290 non-null  float64
 19  Quantity        51290 non-null  int64
 20  Discount        51290 non-null  float64
 21  Profit          51290 non-null  float64
 22  Shipping Cost   51290 non-null  float64
 23  Order Priority  51290 non-null  object
dtypes: datetime64[ns](2), float64(5), int64(2), object(15)
memory usage: 9.4+ MB
コードを書く
準備
まず必要なパッケージをimport
# パッケージインポート
import numpy as np
import scipy
import matplotlib as mpl
import matplotlib.pyplot as plt
import seaborn as sns
import pandas as pd
from pandas.plotting import register_matplotlib_converters
import sklearn
from sklearn.model_selection import train_test_split
from sklearn.preprocessing import LabelEncoder
import os
import mlxtend
from mlxtend.preprocessing import TransactionEncoder
from mlxtend.frequent_patterns import apriori, association_rules, fpgrowth
import networkx as nx
import mca
import codecs
sns.set()
# 日本語を使うときは必要になる(今回は不必要)
font_path = 'C:\\Users\\[YOUR_USERNAME]\\Anaconda3\\envs\\[ENV_NAME]\\Lib\\site-packages\\matplotlib\\mpl-data\\fonts\\ttf\\ipaexg.ttf'
font_prop = mpl.font_manager.FontProperties(fname=font_path)

# それぞれのパッケージのバージョン
"""
numpy 1.18.1
scipy 1.4.1
matplotlib 3.1.3
seaborn 0.10.0
pandas 1.0.3
sklearn 0.22.1
mlxtend 0.17.3
networkx 2.5
mca 1.0.3
"""
データを読み込む。今回は処理を軽くするために8割のデータは捨てる。
with codecs.open('superstore_dataset2011-2015.csv', "r", "shift-jis", "ignore") as f:
    df = pd.read_csv(f, parse_dates=['Order Date','Ship Date'], dayfirst=True)
# 後の処理のために一部のカラムを加工しておく
df['Order Date']=pd.to_datetime(df['Order Date'])
df['Ship Date']=pd.to_datetime(df['Ship Date'])
df['Country']='Country_'+df['Country']
df['Sub-Category']='SubC_'+df['Sub-Category']
# 処理が重かったので、8割くらいのデータは捨てる
df, gomi=train_test_split(df, test_size=0.8, random_state=0)
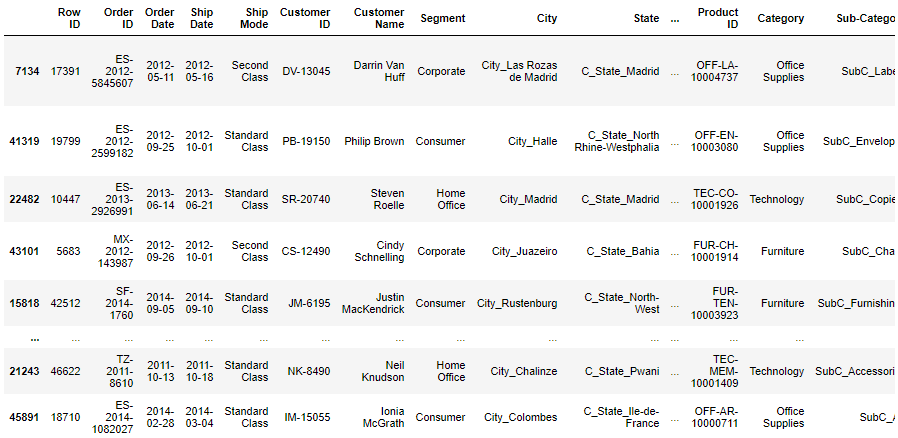
display(df)

# それぞれのカラムの値のユニークな数
"""
Customer ID 1493
Category 3 ;['Office Supplies' 'Technology' 'Furniture']
Sub-Category 17
Product Name 3038
Region 13
Market 7
Country 137
State 891
City 2431
"""
アソシエーション分析
まず、アソシエーション分析を行うためにエンコードなどデータ加工を行う。
※エンコードは昇順で番号が付けられていくので注意。今回はCountryがSub-Categoryよりも若い数字になるということを念頭にその後の処理を実施している。
※あれ?なんでわざわざエンコードなんかしたんだっけ…。しなくても全然問題ないんじゃ…?
# Customer IDごとのCountryのdfとCustomer IDごとのSub-Categoryのdfをconcatしてエンコードする
# エンコードは昇順で番号が付けられていく
ro='Country'
co='Sub-Category'
def create_city_product_matrix(df):
    df_store=df.groupby(['Customer ID',ro,'Order Date'])[[co]].count().reset_index()
    df_product=df.groupby(['Customer ID',co,'Order Date'])[[ro]].count().reset_index()
    df_concat=pd.concat([df_store[['Customer ID',ro,'Order Date']].rename(columns={ro:co}),df_product[['Customer ID',co,'Order Date']]])
    df_concat=df_concat.sort_values(by=['Customer ID','Order Date',co])
    le = LabelEncoder()
    encoded = le.fit_transform(df_concat[co].values)
    df_concat['encoded'] = encoded
    return df_concat[['Customer ID',co,'encoded']], le
# city_cnt:国のユニーク数(後の処理で使う);エンコード後の番号のCountryとSub-Categoryの分かれ目の数字
city_cnt=df[ro].unique().shape[0]

df_label,le=create_city_product_matrix(df)
df_label['flg']=1
display(df_label)
# Customer IDごとにエンコードした数字をlist化
df_list = df_label.groupby(["Customer ID"])["encoded"].apply(lambda x:list(x)).reset_index()
display(df_list)
# アソシエーション分析のためのマート作成
te = TransactionEncoder()
te_ary = te.fit(df_list['encoded']).transform(df_list['encoded'])
df_mart = pd.DataFrame(te_ary, columns=te.columns_)
# df_mart.columns=le.inverse_transform(df_mart.columns.values)
display(df_mart)
アソシエーション分析を実施。
# 支持度5%以上のitemに絞る
min_support=0.05
frequent_itemsets = fpgrowth(df_mart,min_support=min_support,use_colnames=True)
# アソシエーション分析実行
rules = association_rules(frequent_itemsets,metric='support',min_threshold=min_support)
display(rules)
条件部にはCountryが来てほしいので、条件部にCounty、結論部にSub-Categoryが来るようにデータを抽出。
# 条件部にCounty、結論部にSub-Categoryが来るようにrulesを抽出
labels_no_frozen=[i for i in rules['antecedents'].values]
labels_no=[list(i) for i in rules['antecedents'].values]
consequents_no_frozen=[i for i in rules['consequents'].values]
consequents_no=[list(i) for i in rules['consequents'].values]
city_labels=[]
product_labels=[]
for i,k,l,n in zip(labels_no,labels_no_frozen,consequents_no,consequents_no_frozen):
    for j in i:
        # city_cnt-1以下 = Countryのエンコード後の番号
        if j <= city_cnt-1:
            for m in l:
                # city_cnt-1より大きい = Sub-Categoryのエンコード後の番号
                if m > city_cnt-1:
                    # County番号を追加
                    city_labels.append(k)
                    # Sub-Category番号を追加
                    product_labels.append(n)
                    break
                break

rules1=rules[(rules['antecedents'].isin(city_labels))&(rules['consequents'].isin(product_labels))&(rules["antecedents"].apply(lambda x: len(x))==1)&(rules["consequents"].apply(lambda x: len(x))==1)]
max_support=rules1['support'].max()
print('max_support',max_support)
display(rules1)
後に、Sub-Category同士の組み合わせも可視化したいので、条件部にも結論部にもSub-Categoryが来るようにデータを抽出しておく。
# 条件部にも結論部にもSub-Categoryが来るようにrulesを抽出
labels_no_frozen=[i for i in rules['antecedents'].values]
labels_no=[list(i) for i in rules['antecedents'].values]
consequents_no_frozen=[i for i in rules['consequents'].values]
consequents_no=[list(i) for i in rules['consequents'].values]
city_labels=[]
product_labels=[]
for i,k,l,n in zip(labels_no,labels_no_frozen,consequents_no,consequents_no_frozen):
    for m in l:
        # city_cnt-1より大きい = Sub-Categoryのエンコード後の番号
        if m > city_cnt-1:
            city_labels.append(k)
            product_labels.append(n)
            break
        break

rules11=rules[(rules['antecedents'].isin(product_labels))&(rules['consequents'].isin(product_labels))&(rules["antecedents"].apply(lambda x: len(x))==1)&(rules["consequents"].apply(lambda x: len(x))==1)&(rules['support']<=max_support)]
display(rules11)
アソシエーション分析の結果の表をデコードする。
# アソシエーション分析の結果の表を作る
def create_association_matrix(rules1):
    # rules1のantecedentsをデコード
    antecedents_scale=pd.DataFrame(le.inverse_transform([list(i)[0] for i in rules1['antecedents'].unique()]),columns=[co])
    antecedents_scale['antecedents']=[i for i in rules1['antecedents'].unique()]

    # rules1のconsequentsをデコード
    # 一応複数の組み合わせがあっても大丈夫なようにしている
    consequents=[list(i) for i in rules1['consequents'].unique()]
    consequents=[([le.inverse_transform([i])[0] for i in j]) for j in consequents]
    consequents_scale=pd.DataFrame(consequents,columns=[co])
    consequents_scale['consequents']=[i for i in rules1['consequents'].unique()]

    rules3=pd.merge(rules1, antecedents_scale, on=['antecedents'], how='left').rename(columns={co:'antecedents_name'})
    rules3=pd.merge(rules3, consequents_scale, on=['consequents'], how='left').rename(columns={co:'consequents_name'})
    rules3=rules3.reindex(columns=['antecedents_name','consequents_name','support','confidence','lift','antecedents','consequents'])
    return rules3
rules3=create_association_matrix(rules1)
rules33=create_association_matrix(rules11)
display(rules3)
display(rules33)
アソシエーション分析の結果をネットワーク図で表現してみる。
# Countryごとの人数をカウント
def create_country_uu(df_label):
    count_UU=df_label.groupby([co,'Customer ID'])[['flg']].count().reset_index()
    count_UU['cnt']=1
    count_UU=count_UU.groupby([co])[['cnt']].sum().reset_index()
    return count_UU

# ノード、エッジを作る
GA=nx.from_pandas_edgelist(rules1[['antecedents','consequents','lift']],source='antecedents',target='consequents', edge_attr=True)

count_UU=create_country_uu(df_label)
count_UU_mst=pd.DataFrame(le.inverse_transform([list(i)[0] for i, j in GA.nodes(data=True) if i in rules1['antecedents'].values]),columns=[co])
count_UU_mst=pd.merge(count_UU_mst, count_UU, on=[co],how='left').rename(columns={co:ro})

# ノードのマスタを作る(デコード)
labels_no=[list(j) for j in [i for i in GA.nodes]]
labels=[]
for no in labels_no:
    labesl2=[]
    for label in no:
        labesl2.append(le.inverse_transform([label])[0])
    labels.append(labesl2)

new_labels2={}
for i, j in zip(GA.nodes, labels):
    new_labels2[i]=j
# アソシエーション分析の結果をネットワーク図で表現
def association_network(GA, rules1, count_UU_mst):
    fig, ax=plt.subplots(figsize=(30,15))
    pos = nx.kamada_kawai_layout(GA,scale=0.06)

    # エッジの太さはリフト値に比例させる
    edge_width = [d['lift']*8 for (u,v,d) in GA.edges(data=True)]

    # Countryを正方形でプロット
    # ノードサイズはCountryごとのUU数に比例させる
    nx.draw_networkx_nodes(GA, pos, alpha=0.5, node_shape="s", linewidths=5, node_color='red',
                           nodelist=[i for i, j in GA.nodes(data=True) if i in rules1['antecedents'].values],
                           node_size=[4.*v for v in count_UU_mst['cnt'].values])

    # Sub-Categoryを円形でプロット
    nx.draw_networkx_nodes(GA, pos, alpha=0.5, node_shape="o", linewidths=0, node_color='blue', node_size=600,
                           nodelist=[i for i, j in GA.nodes(data=True) if i in rules1['consequents'].values])

    # エッジをプロット
    nx.draw_networkx_edges(GA, pos, alpha=0.2, edge_color='grey', width=edge_width)
    #ラベルの設置をする
    datas = nx.draw_networkx_labels(GA,pos,new_labels2,font_size=20)

    # 日本語に対応できるようにするため、日本語が使えるフォントを設定
    #for t in datas.values():
    #    t.set_fontproperties(font_prop)

    plt.grid(False)
    plt.show()

association_network(GA, rules1, count_UU_mst)

これはまた見づらい図…。
赤い四角の大きさはその国のCustomer数に比例していて、灰色線の太さはリフト値に比例している。
先進国ではいろんなカテゴリーの商品が買われていて、発展途上国では一部のカテゴリーの商品が買われているような傾向にあると言えるかも。
ただし、まだこの図ではノード同士の位置関係は意味をなしていない。
コレスポンデンス分析を合わせることにより、ノードの位置関係も意味を持つ図を作るのが今回の目的だ。
コレスポンデンス分析
コレスポンデンス分析を行うためのマートを作成。
# CountryとSub-Categoryの売り上げのクロス表を作る
df_corre=df.copy()
df_corre=df_corre.pivot_table(index=ro, columns=co, values='Sales', aggfunc=lambda x:x.sum()).fillna(0)
display(df_corre)
コレスポンデンス分析を実施。
# コレスポンデンス分析をプロット
fig, ax=plt.subplots(figsize=(30,20))

mca_counts = mca.MCA(df_corre)
rows = mca_counts.fs_r(N=2)
cols = mca_counts.fs_c(N=2)

ax.scatter(rows[:,0], rows[:,1], c='red',marker='s', s=200)
labels = df_corre.index.values
for label,x,y in zip(labels,rows[:,0],rows[:,1]):
        ax.annotate(label,xy = (x, y),fontsize=20)

ax.scatter(cols[:,0], cols[:,1], c='blue',marker='x', s=400)
labels = df_corre.columns.values
for label,x,y in zip(labels,cols[:,0],cols[:,1]):
        ax.annotate(label,xy = (x, y),fontsize=20, color='c')

ax.tick_params(left=True, bottom=True, labelleft=True, labelbottom=True)
ax.axhline(0, color='gray')
ax.axvline(0, color='gray')
plt.show()

重なってほとんど見えないけど、各国や商品カテゴリーの位置関係に意味を持つ図ができる。(ザンビアとモーリタニアとアフガニスタンとシンガポールの購買傾向が似ているとか。本当か…?)
この図に、アソシエーション分析の結果のエッジを追加できれば、属性特化型特徴抽出アソシエーションプロットの完成である。
属性特化型特徴抽出アソシエーションプロット
まず、先ほどと同様にコレスポンデンス分析を実施。
mca_counts = mca.MCA(df_corre)
rows = mca_counts.fs_r(N=2)
cols = mca_counts.fs_c(N=2)
先ほどはコレスポンデンス分析の結果をplt.scatterでプロットしたが、ここではnetworkxを使う。
# コレスポンデンス分析とアソシエーション分析の結果をnetwork図で表現
def mca_association_plot(df_corre, df_label, rows, cols, new_labels2
                         , strong_node_row=None, strong_node_col=None
                         , xlim=[None, None], ylim=[None, None]):
    fig, ax=plt.subplots(figsize=(30,20))
    uu_list=create_country_uu(df_label)

    # Countryを赤い四角でプロット
    G = nx.Graph()
    node_weights=[]
    for node, pos in zip(df_corre.index, rows):
        if strong_node_row is None:
            G.add_node(node)
            G.nodes[node]["pos"] = (pos[0], pos[1])
            node_weights.append(uu_list[uu_list[co]==node]['cnt'].values[0])
        else:
            if node in strong_node_row:
                G.add_node(node)
                G.nodes[node]["pos"] = (pos[0], pos[1])
                node_weights.append(uu_list[uu_list[co]==node]['cnt'].values[0])
    position=np.array([v['pos'] for (u,v) in G.nodes(data=True)])
    pos = {n:(i[0], i[1]) for i, n in zip(position ,G.nodes)}
    nx.draw_networkx(G, pos=pos, node_color="red",ax=ax, linewidths=5, node_shape="s", node_size=[1.5*v for v in node_weights], alpha=0.5)
    new_labels2={}
    for i, j in zip(G.nodes, G.nodes):
        new_labels2[i]=j
    datas = nx.draw_networkx_labels(G,pos, new_labels2, font_size=20, font_color='k')
    #日本語に対応できるようにするため、日本語が使えるフォントを設定している
    #for t in datas.values():
    #    t.set_fontproperties(font_prop)

    # Sub-Categoryを青いバツ印でプロット
    G2 = nx.Graph()
    node_weights2=[]
    for node, pos in zip(df_corre.columns, cols):
        if strong_node_col is None:
            G2.add_node(node)
            G2.nodes[node]["pos"] = (pos[0], pos[1])
            node_weights2.append(uu_list[uu_list[co]==node]['cnt'].values[0])
        else:
            if node in strong_node_col:
                G2.add_node(node)
                G2.nodes[node]["pos"] = (pos[0], pos[1])
                node_weights2.append(uu_list[uu_list[co]==node]['cnt'].values[0])
    position2=np.array([v['pos'] for (u,v) in G2.nodes(data=True)])
    pos2 = {n:(i[0], i[1]) for i, n in zip(position2 ,G2.nodes)}
    nx.draw_networkx(G2, pos=pos2, node_color="blue",ax=ax, node_shape="x", node_size=[5*v for v in node_weights2], alpha=0.5)
    new_labels2={}
    for i, j in zip(G2.nodes, G2.nodes):
        new_labels2[i]=j
    datas = nx.draw_networkx_labels(G2,pos2, new_labels2, font_size=20, font_color='b')
    #日本語に対応できるようにするため、日本語が使えるフォントを設定している
    #for t in datas.values():
    #    t.set_fontproperties(font_prop)

    # CountryとSub-Categoryの間のエッジをプロット(灰色でリフト値に比例して太くなる)
    U=nx.Graph()
    U.add_nodes_from(G.nodes(data=True)) #deals with isolated nodes
    U.add_nodes_from(G2.nodes(data=True))
    for edge1, edge2, lift in zip(rules3[rules3['lift']>=1.6]['antecedents_name'].values, rules3[rules3['lift']>=1.6]['consequents_name'].values, rules3[rules3['lift']>=1.6]['lift'].values):
        if strong_node_col is None:
            U.add_edge(edge1, edge2, lift=lift)
        else:
            if edge2 in strong_node_col:
                U.add_edge(edge1, edge2, lift=lift)
    pos_all = {n:(i[0], i[1]) for i, n in zip(np.vstack((position, position2)) ,U.nodes)}
    edge_width = [d['lift']*8. for (u,v,d) in U.edges(data=True)]
    nx.draw_networkx_edges(U, pos=pos_all, alpha=0.3, edge_color='grey', width=edge_width, ax=ax)

    # Sub-CategoryとSub-Categoryの間のエッジをプロット(水色でリフト値に比例して太くなる)
    V=nx.Graph()
    V.add_nodes_from(G.nodes(data=True)) #deals with isolated nodes
    V.add_nodes_from(G2.nodes(data=True))
    for edge1, edge2, lift in zip(rules33[rules33['lift']>=1.5]['antecedents_name'].values, rules33[rules33['lift']>=1.5]['consequents_name'].values, rules33[rules33['lift']>=1.5]['lift'].values):
        if strong_node_col is None:
            V.add_edge(edge1, edge2, lift=lift)
        else:
            if edge1 in strong_node_col and edge2 in strong_node_col:
                V.add_edge(edge1, edge2, lift=lift)
    pos_all2 = {n:(i[0], i[1]) for i, n in zip(np.vstack((position, position2)) ,V.nodes)}
    edge_width = [d['lift']*8. for (u,v,d) in V.edges(data=True)]
    nx.draw_networkx_edges(V, pos=pos_all2, alpha=0.2, edge_color='c', width=edge_width ,ax=ax)

    ax.tick_params(left=True, bottom=True, labelleft=True, labelbottom=True)
    ax.set_xlim(xlim[0], xlim[1])
    ax.set_ylim(ylim[0], ylim[1])
    ax.axhline(0, color='gray')
    ax.axvline(0, color='gray')
    plt.grid(True)
    plt.show()
いざ実施。
xlim=[None,None]
ylim=[None,None]
mca_association_plot(df_corre, df_label, rows, cols, new_labels2, strong_node_row=None, strong_node_col=None, xlim=xlim, ylim=ylim)

バーーーーン
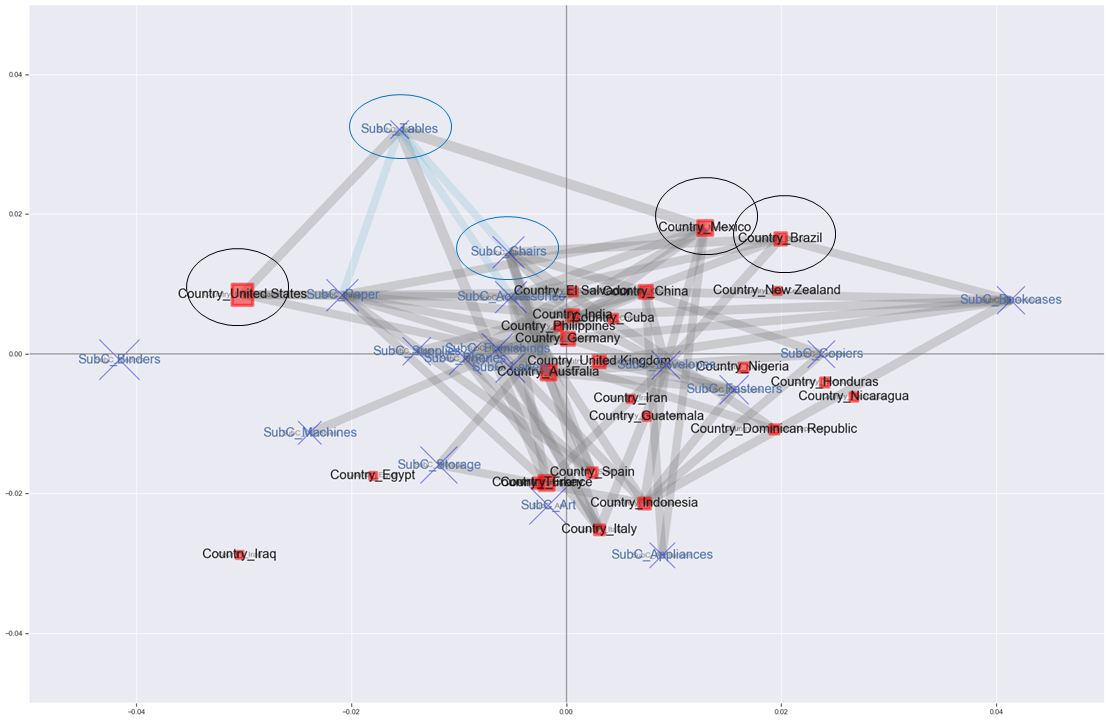
コレスポンデンス分析の結果にアソシエーション分析の結果を反映させた図ができた。
灰色のエッジは国と商品サブカテゴリーとの関係、水色のエッジは商品サブカテゴリー同士の関係を表している。
エッジはリフト値が1.6以上(灰色)、1.5以上(水色)のものだけ引いている。
赤い四角と青いバツはCustomer IDのユニーク数に比例して大きくなる。
とはいっても重なってよく分からないので、真ん中をちょっと拡大して見る。
xlim=[-0.05,0.05]
ylim=[-0.05,0.05]
mca_association_plot(df_corre, df_label, rows, cols, new_labels2, strong_node_row=None, strong_node_col=None, xlim=xlim, ylim=ylim)

拡大しても、よくわかんない(笑)。
でもアメリカは購入する客が最も多くて、Bindersが売れる傾向にある位置にいるけどエッジはつながっていなくて、Tablesとエッジがつながっているとかはわかる。
売り上げ的に目立つのはBindersかもしれないけど、全ての国の中でTablesを購入した客の割合より、実はアメリカでTablesを購入した客の割合の方が1.6倍以上高いよって感じか。よくわからんね。
プロットされるノードを減らすため、支持度が0.05以上だった項目だけを対象に、再度プロットしてみる。
# 支持度0.05以上の項目だけ使う
strong_single_product=list(set([[j for j in i][0] for i in frequent_itemsets['itemsets']]))
strong_single_product=le.inverse_transform(strong_single_product)
row_word = 'Country_'
strong_node_row = [v for i, v in enumerate(strong_single_product) if row_word in v]
strong_node_col = [v for i, v in enumerate(strong_single_product) if row_word not in v]

xlim=[-0.05,0.05]
ylim=[-0.05,0.05]
mca_association_plot(df_corre, df_label, rows, cols, new_labels2, strong_node_row=strong_node_row, strong_node_col=strong_node_col, xlim=xlim, ylim=ylim)

結局エッジが飛び交いすぎて見にくい…。無理やり解釈していくと…。
・左のアメリカ、真ん中のドイツ・イギリス、右上のブラジル・メキシコ、下のスペイン・イタリヤなど、それぞれ傾向が異なると考えられる
・全ての国の中でTablesを購入した客の割合より、メキシコでTablesを購入した客の割合の方が1.6倍以上高い
・ブラジルはメキシコと同じ傾向の国なので、Tablesを推してもいいかもしれない
・TablesとChairs, Paperの組み合わせも買う人が多いと言えるので、アメリカはChairをもっと推してもいいかもしれない
とか?いや、解釈むずいわ。
とある国の店舗ごとの分析とかだったら解釈しやすいかもしれないな…。
おわりに
属性特化型特徴抽出アソシエーションプロットを実施した。
しかし解釈がかなり難しかった…。
計算機統計学 29巻 22号 の"売り上げ傾向による店舗の分類と購買傾向の分析と可視化"と同じようなアプローチだとまた意味のある分析ができるかもしれない。
個人的にはnetworkxの練習になったからよかった。
以上!


