テクロスというゲーム会社で学生バイトとして勉強している初心者プログラマーです。
今回は大学院で研究する際、データを解析するのにpythonで3Dグラフ描く時ちょこっと困ったので自分用にメモします。これが誰かの助けになれば、、
はじめに

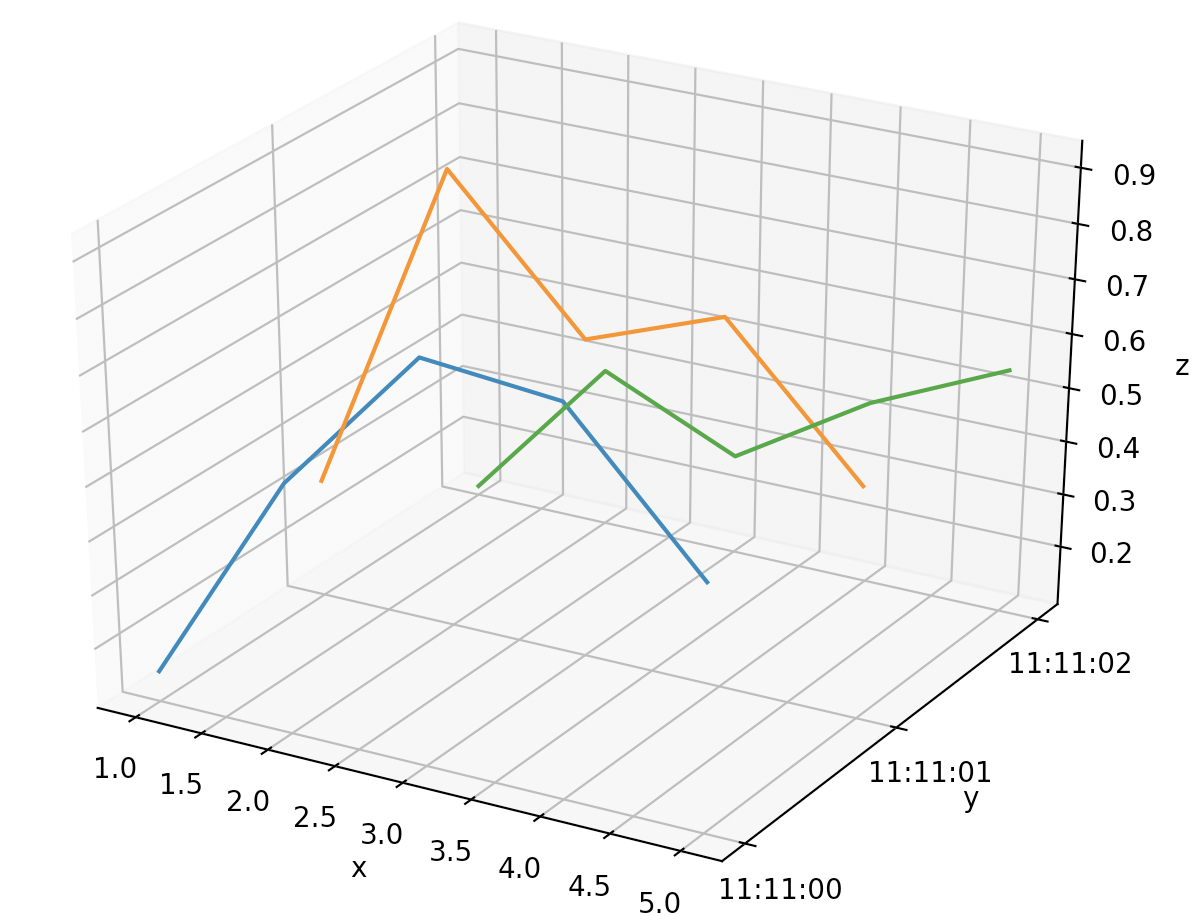
こんな感じのグラフを描きます。軸ラベルと時間が重なってるけど気にしない。
matplotlibとAxes3Dを用います。
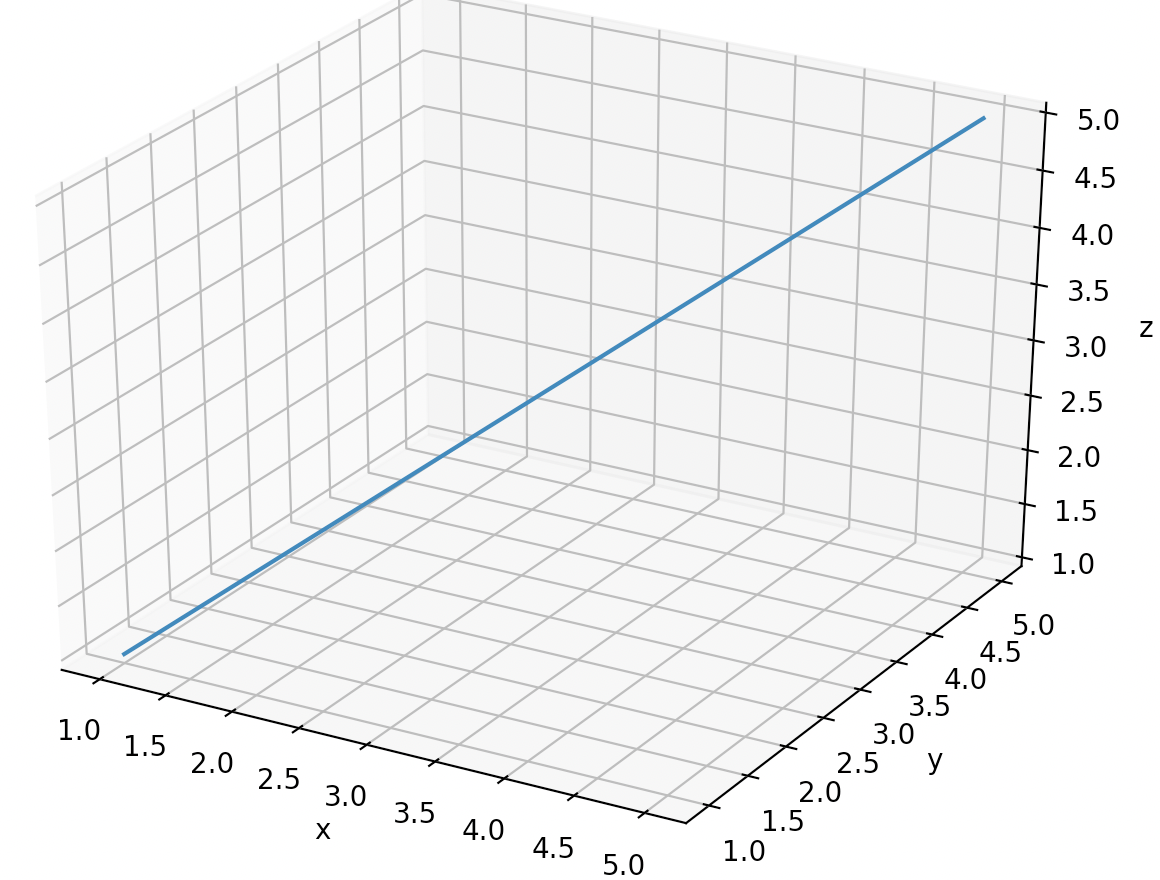
とりあえず3Dに何かをプロットしてみる
【Matplotlib】3D直線グラフの作成を参考にしました! ありがとうございます。
# -*- coding: utf-8 -*-
import numpy as np         ### 今回はnumpy使ってないんでいらねーです
import matplotlib.pyplot as plt        ### グラフ描くなら2D3D関係なく必要
from mpl_toolkits.mplot3d import Axes3D      ### 3Dなら必要

# (x, y, z)
x = [1, 2, 3, 4, 5]
y = [1, 2, 3, 4, 5]
z = [1, 2, 3, 4, 5]
# 3Dでプロット
fig = plt.figure()
ax = Axes3D(fig)
ax.plot(x, y, z)
# 軸ラベル
ax.set_xlabel('x')
ax.set_ylabel('y')
ax.set_zlabel('z')
# 表示
plt.show()
サクサク行きましょう。
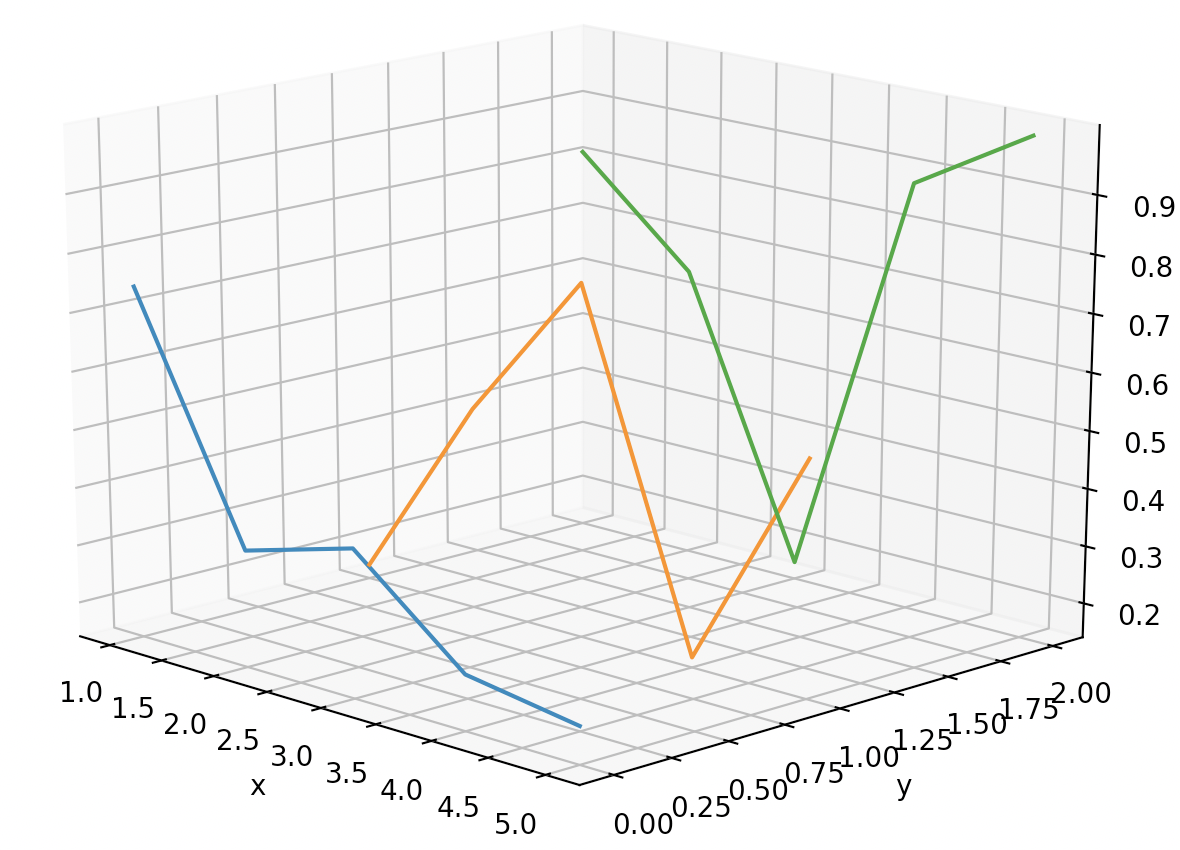
複数の配列を一つのグラフに描画する
for文使えば一瞬ですね。
# -*- coding: utf-8 -*-
import numpy as np       ### 今回はnumpy配列使うので必要
import matplotlib.pyplot as plt
from mpl_toolkits.mplot3d import Axes3D

### 3Dグラフの箱を用意(多分)
fig = plt.figure()
ax = Axes3D(fig)

### x軸は共通にします
x = [1, 2, 3, 4, 5]

### 今回は3本のデータを一つのグラフにします
for i in range(3):

	### 要素数5で要素は全てi
	y = np.full(5,i)

	### 要素数5で要素は0以上1以下の乱数
	z = np.random.rand(5)

	# 3Dでプロット
	ax.plot(x, y, z)

# 軸ラベル
ax.set_xlabel('x')
ax.set_ylabel('y')
ax.set_zlabel('z')
# 表示
plt.show()
こんな感じになります。
サクサク行きましょう。
軸の値をstringにしたい!!
例えばy軸を「1月,2月,3月」にするみたいなイメージ。
# -*- coding: utf-8 -*-
import numpy as np
import matplotlib.pyplot as plt
from mpl_toolkits.mplot3d import Axes3D

fig = plt.figure()
ax = Axes3D(fig)

### y軸の数値を入れる配列
y_num = np.array([])
### y軸に設定したい文字列を入れる配列
y_axis = np.array([])

x = [1, 2, 3, 4, 5]

for i in range(3):
	y = np.full(5,i)
	z = np.random.rand(5)
	ax.plot(x, y, z)

	y_num = np.append(y_num,i)
	y_axis = np.append(y_axis,"{}data".format(i))

### y_numは[0,1,2]
### y_axisは[0data,1data,2data]

plt.yticks(y_num,y_axis)

ax.set_xlabel('x')
ax.set_ylabel('y')
ax.set_zlabel('z')

plt.show()
実行すると

完成〜〜!!!簡単だね。
最初plt.yticks()じゃなくてax.yticks()って使っててできなかった、、
ついでに
二個目のグラフで、軸の数値間隔が小さすぎるとか大きすぎるとかあればax.set_xticks()って関数を使えばいいよ。
最後のグラフでy軸を日時にしてみます。
# -*- coding: utf-8 -*-
import numpy as np
import matplotlib.pyplot as plt
from mpl_toolkits.mplot3d import Axes3D

### 日時表示にするなら必要
from datetime import datetime
import time

fig = plt.figure()
ax = Axes3D(fig)
y_num = np.array([])
y_axis = np.array([])
x = [1, 2, 3, 4, 5]

for i in range(3):
	y = np.full(5,i)
	z = np.random.rand(5)
	ax.plot(x, y, z)
	y_num = np.append(y_num,i)

	### y_axisに適当に日時をstringとして追加
	y_axis = np.append(y_axis,"2019-1-1 11:11:0{}".format(i))
	### stringになった時間をdatetime型に
	temp_datetime = datetime.strptime(y_axis[i],'%Y-%m-%d %H:%M:%S')
	### 時間だけを抽出してstring型に
	y_axis[i] = temp_datetime.strftime('%H:%M:%S')

plt.yticks(y_num,y_axis)
ax.set_xlabel('x')
ax.set_ylabel('y')
ax.set_zlabel('z')
plt.show()
目標としてたグラフを描くことができました!!めでたし。
あ、pythonで日時を処理したいときはdatetimeを使用しましょう。
これハマる人はハマります。研究データを扱う際、日時の型がdatetimeじゃなかったりしますが、datetimeに直した方が楽です。
終わりに
ちょっとサクサク行きすぎでしたでしょうか。説明欲しいとこあればコメントください。追記します。
日時の部分間抜けな書き方してるかもしれません。エレガントに書けたら教えてください。
グラフ描けるようになったから早く研究しないと。。


