この記事について
この記事では非線形次元削減手法のtSNEを実装を通して学ぶことを目指す。tSNEの理論の詳細については他に多数の記事があるので本記事では行わない、本記事はアルゴリズムの提示のみにとどめる。
また、tSNEの実装には参考サイト[1] などがあるが、本記事ではあくまでtSNEを最低限理解するための最小限の実装にとどめる。そのため実行速度の高速化などについては考慮しない。本記事の実装のほとんどの部分は参考サイト[2]を参考に作成した。
なお、tSNEの理論については参考サイト[3]や元論文が参考になる。
tSNEのアルゴリズム
Step1. 分散の決定
データ$x_1,..,x_n$に対して、tSNEでは$x_i$から$x_j$への距離をガウス分布により定義する。すなわち、
p_{j|i}=\frac{\exp(-||x_i-x_j||^2/2\sigma^2_i)}{\sum_{k\ne i}\exp(-||x_i-x_k||^2/2\sigma^2_i)} \tag{1}
今回はSymmetricな距離を使うとして、
p_{ij}=\frac{p_{j|i}+p_{i|j}}{2n} \tag{2}
分散$\sigma_i$は事前に定義された定数である$Perplexity$(5~50くらい)により下記の式をみたすようにデータごとに決定される。
Perplexity=2^{-\sum_j p_{j|i}\log_2 p_{j|i}} \tag{3}
実装
まずデータ行列Xのユークリッド距離行列を返す関数を作る。これが式(1)の$||x_i-x_j||^2$に相当する。
def get_dists(X, sklearn=True):
  n = X.shape[0]
  dists = np.zeros([n, n])

  for i in range(n):
    for j in range(i, n):
      dists[i, j] = np.sum((X[i,:] - X[j,:])**2)
  return dists + dists.T
get_dists()を使って得られる距離行列をもとに式(1)に従って$p_{j|i}$を計算する。
D = get_dists(X)
d = D[i,:]

#sigma_iは二分木探索で決定されるが、ここでは適当な値が設定されているものとする
d_scaled = -d/(2*sigma_i**2)
exp_D = np.exp(d_scaled)
exp_D[i] = 0 #対角成分は0にする
p_ji = exp_D / np.sum(exp_D)
このときのperplexityを計算する。(式(3))
current_perp = 2 ** (np.sum(-p_ji*np.log2(p_ji+1e-10)))
sigma_iは二分木探索で決まり、これをすべての$i$に対して実行する。sigma_iが決まったら、P[i,:] = p_jiで$p_{j|i}$が$P_{ij}$に対応する行列に格納する。
最後に式(2)を計算する。
(P+P.T)/(2*n)
以上をまとめてget_Pという関数に書き下す
def get_P(X, target_perp,lowerbound=0, upperbound=1e4, maxit=250, tol=1e-6):
  D = get_dists(X)
  n = D.shape[0]
  P = np.zeros(D.shape)

  for i in tqdm(range(n)):
    lowerbound_i = lowerbound
    upperbound_i = upperbound
    d = D[i,:]

    for t in tqdm(range(maxit), leave=False):
      sigma_i = (lowerbound_i + upperbound_i) / 2

      #calculate p_j|i
      d_scaled = -d/(2*sigma_i**2)
      d_scaled -= np.max(d_scaled)
      exp_D = np.exp(d_scaled)
      exp_D[i] = 0
      p_ji = exp_D / np.sum(exp_D)

      #calculate entropy
      current_perp = 2 ** (np.sum(-p_ji*np.log2(p_ji+1e-10)))

      if current_perp < target_perp:
        lowerbound_i = sigma_i
      else:
        upperbound_i = sigma_i

      if np.abs(current_perp-target_perp) < tol:
        break
      #print(f"i={i}, current_perp={current_perp}, sigma={sigma_i}")
      if p_ji.max() > 100:
        print(f"{p_ji.max()=}")
        print(f"{p_ji.min()=}")
    P[i,:] = p_ji
  return (P+P.T)/(2*n)
pijはexaggerationというパラメータで増幅される
pij = exg * get_P(X, perplexity=30)
Step2. 勾配の計算
圧縮先のデータ$y_1,...,y_n$を最初はランダムに配置する。$y_i$から$y_j$に対してスチューデントのt分布により定義される距離$q_{ij}$と$p_{ij}$のKLダイバージェンスを最小化する。最小化するため、KLダイバージェンスを$y_i$で微分した結果をデータ$i$の勾配として$y_i$の位置を更新していく。
q_{ij}=\frac{(1+||y_i-y_j||)^{-1}}{\sum_{k\ne l}(1+||y_k-y_l||)^{-1}} \tag{4}
KLダイバージェンスは下記で定義される
KL(P||Q)=\sum_{i,j}p_{i,j}\log(\frac{p_ij}{q_{ij}})
微分して、勾配を得る
\frac{dKL(P||Q)}{dy_i}=4\sum_j \frac{p_{ij}-q_{ij}}{(1+||y_i - y_j||)^{-1}}(y_i-y_j) \tag{5}
実装
まずは式(4)に従いqijを決める。Yは既に定義されているものとする(最初は正規分布などで適当に決める)
d = get_dists(Y)
Y_dist = np.power(1 + d, -1)
np.fill_diagonal(Y_dist, 0) #対角成分は0に
qij = Ydist / np.sum(Ydist)
続いて式(5)に従い勾配gradを求める
n = Y.shape[0]
dY = np.zeros(shape = Y.shape)
rij = pij - qij
for i in range(n):
  for j in range(n):
    dY[i,:] += 4 * rij[i,j] * (Y[i,:] - Y[j,:]) * Y_dists[i,j]
grad = dY
Step3. 更新
現在の$Y$を$Y^{(t)}$とし、1,2ステップ前の$Y^{(t-1)},Y^{(t-2)}$を使ってモメンタム付きの勾配降下法によりこれを更新する。
Y^{(t)}=Y^{(t-1)}+\eta\frac{dKL(P||Q)}{dY}-\alpha(Y^{(t-1)}-Y^{(t-2)}) \tag{6}
実装
#Y_m1は現在のY, Y_m2は1ステップ前のYで、これらにより新しいY_newを決める
Y_new = Y_m1 - eta*grad + alpha*(Y_m1 - Y_m2)
実装のまとめ
以上の処理をまとめると、下の関数となる。要点を絞るとかなりシンプルに書けることがわかる。
def tsne(X, niter=10, n_components=2, perplexity=10, exg=4, eta=0.1, alpha=0.8, return_all_iter=False, initialize_pca=False, min_grad_diff=1e-7, exg_thr=50, n_features_in=20):
  """
  Args)
    X (np.array):
      変換したいデータ
  Returns)
    Y: embeded array
  """
  X = pca(X, n_components=n_features_in).real

  #Get affinities with exaggeration
  pij = exg * get_P(X, perplexity)

  #Initialization
  size = (pij.shape[0], n_components)
  Y = np.zeros(shape = (niter+2, size[0], n_components))
  initial_vals = pca(X, n_components=n_components).real if initialize_pca else np.random.normal(0.0, np.sqrt(1e-4), size)
  Y_m1 = Y_m2 = initial_vals
  Ys = [Y_m2, Y_m1]
  error = error_prev = 0

  for i in tqdm(range(2,niter+2)):
    if i == int(exg_thr):
      pij /= exg

    #Calculate qij
    ## qij = (1 + ||yi - yj||^(-1) / sum(1 + ||yi - yj||^(-1)))
    d = get_dists(Y_m1)
    Ydist = np.power(1 + d, -1)
    np.fill_diagonal(Ydist, 0)
    #qij = Ydist / np.sum(Ydist, axis=0)
    qij = Ydist / np.sum(Ydist)
    grad = grad_py(pij, qij, Ydist, Y_m1)
    #print(f" error:{np.linalg.norm(grad)}")
    error = np.linalg.norm(grad)
    if abs(error-error_prev) < min_grad_diff:
      break

    #update learning rate
    eta = step_based_lr(i, eta)

    #Update embeddings
    Y_new = Y_m1 - eta*grad + alpha*(Y_m1 - Y_m2)
    #Y_new = Y_new - np.mean(Y_new, axis=0)
    Y_m2, Y_m1 = Y_m1, Y_new
    Ys.append(Y_new)

    error_prev = error

  if return_all_iter:
    return Ys
  else:
    return Ys[-1]
実際に動かしてみる
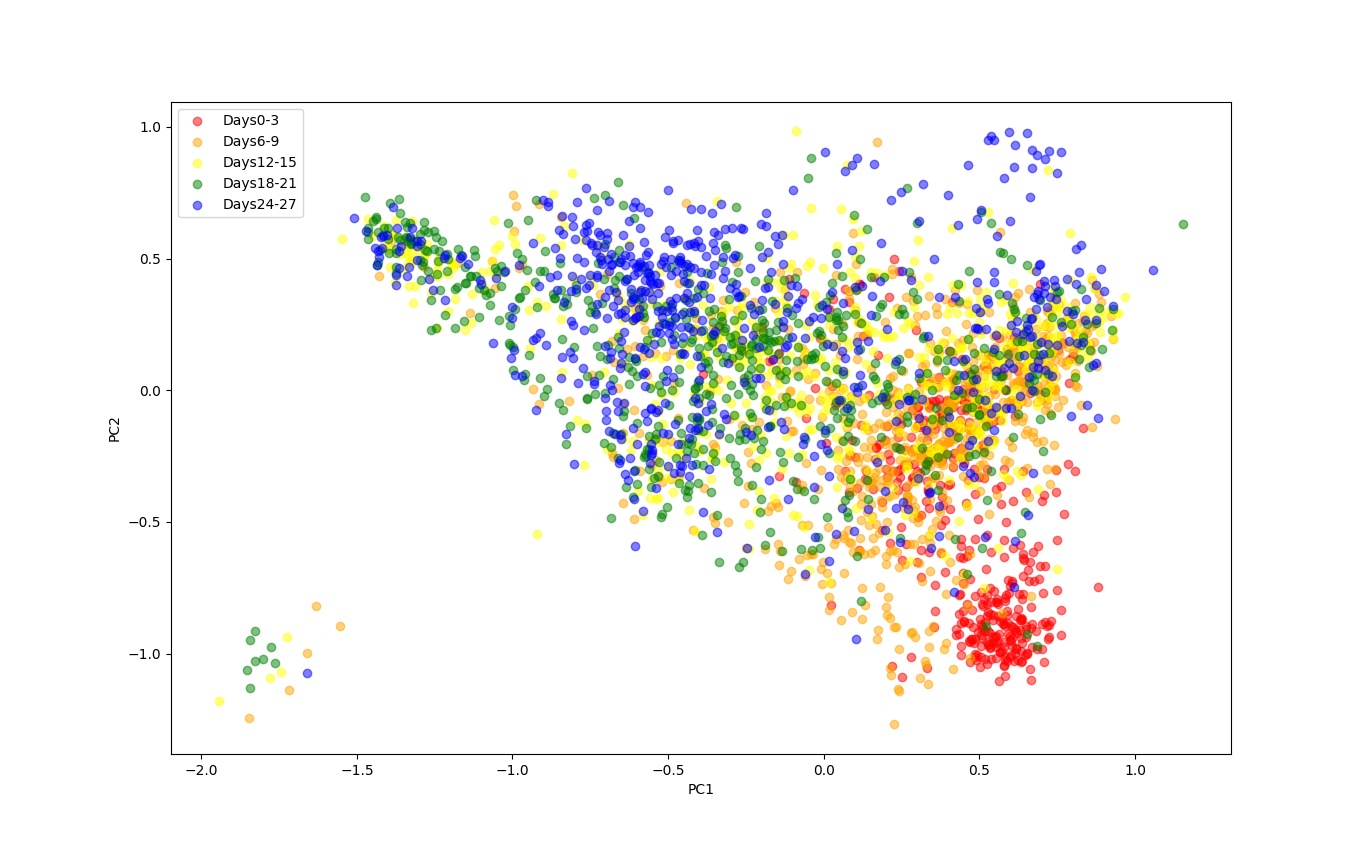
2000次元の遺伝子発現量を特徴量としてもつ細胞のデータ(細胞数3102)を2次元に圧縮してプロットすると下図のようになった。何日目にサンプルされたかで色を分けて表示すると、最初の3日間と20日以降で異なるクラスタを形成していることが確認できる。

初期状態からのYの変化のアニメーションは下図のようになった

Xの初期状態としてPCAで30次元に圧縮したデータを使用しており、これをしないとあまりきれいな結果が得られなかった。Yの初期状態は意外と結果に影響しなかった。またeta=100, perplexity=30に設定した。
付録
ここまでで省略した関数を示す。
def step_based_lr(t, eta, d=0.01, r=30):
  """
  学習率の調整
  """
  return eta*d**np.floor((1+t)/r)

def pca(X, n_components=2):
  """
  PCA実行
  Args)
    X (np.array):
      変換したい行列
  Returns)
    transformed
  """
  # 共分散行列計算
  ## Sigma.shape = (3102, 3102)
  N = X.shape[0]
  X_ = X - X.mean(axis=0).reshape(1,-1)
  Sigma = 1/N * X_.T @ X_

  # 共分散行列の固有値、固有ベクトル計算
  lambdas, eigenvectors = np.linalg.eig(Sigma)

  # 固有値が大きい順でソート=射影先の分散が大きい順でソート
  idx = lambdas.argsort()[::-1]
  lambdas, eigenvectors = lambdas[idx], eigenvectors[idx]

  # 変換
  ## transformed.shape = (3102, 2000)
  transformed = X_ @ eigenvectors

  return transformed[:,:n_components]

from sklearn.metrics import pairwise_distances

def get_dists(X, sklearn=True):
  """
  numpyで高速化するget_dists()
  """
  if sklearn:
    dists = pairwise_distances(X, metric="sqeuclidean")
    return dists

  n = X.shape[0]
  dists = np.zeros([n, n])

  for i in range(n):
    for j in range(i, n):
      dists[i, j] = np.sum((X[i,:] - X[j,:])**2)
      print(f"{i},{j}")
  return dists + dists.T

def grad_py(pij, qij, Y_dists, Y, numpy=True):
  """
  numpyで高速化するgrad_py
  """
  n = Y.shape[0]
  dY = np.zeros(shape = Y.shape)
  rij = pij - qij

  if numpy:
    for i in tqdm(range(n), leave=False):
      dY[i,:] = 4*np.dot(rij[i,:]*Y_dists[i,:], Y[i,:] - Y)
  else:
   for i in range(n):
     for j in range(n):
       dY[i,:] += 4 * rij[i,j] * (Y[i,:] - Y[j,:]) * Y_dists[i,j]

  return dY
ソースコードはGithubに公開している。
参考サイト
[1]Kernel t-SNEを使ったデータの分類をフルスクラッチ実装でやってみた
[2]Python Implementation of t-SNE
[3]t-SNE clearly explained
[4]Visualizing Data using t-SNE