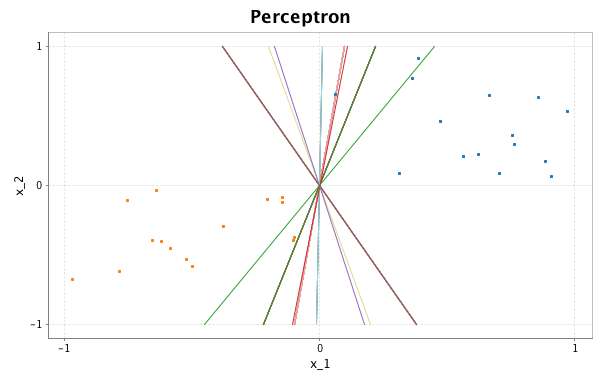
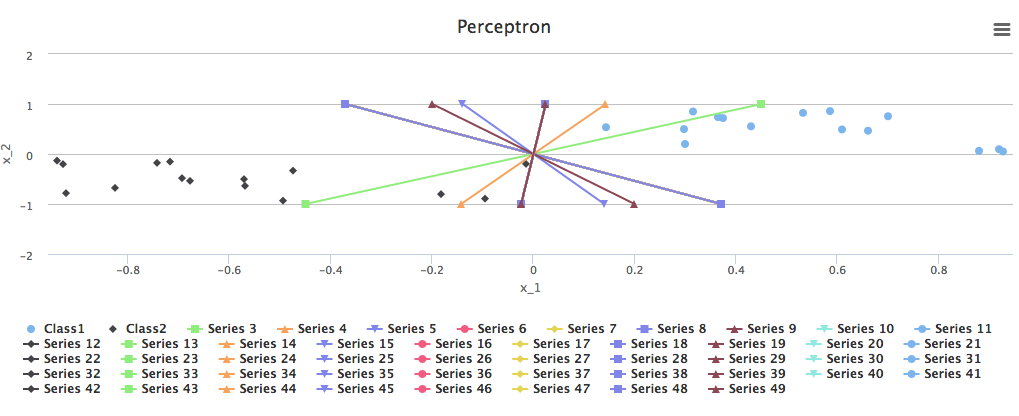
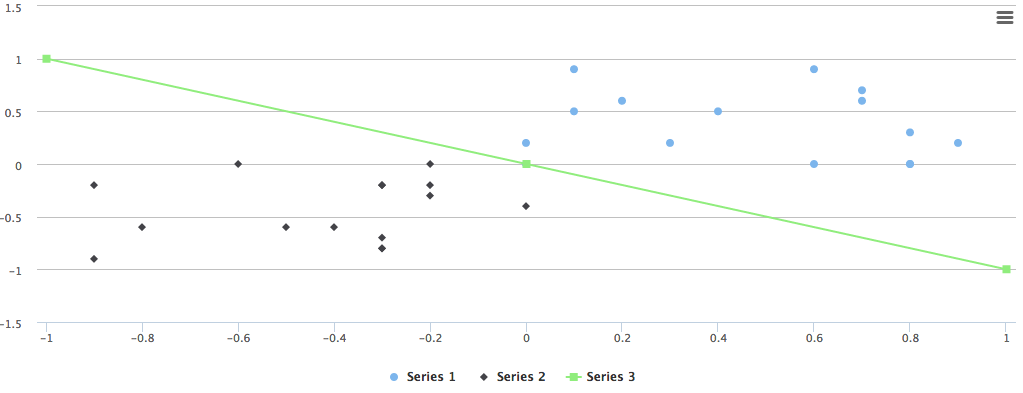
とりあえず引用からスタート
WISP:
Wisp : Wisp Is Scala Plotting is a console-centric plotting library for scala. It focuses on existing web-based plotting libraries, and strives to bring the power and flexibility of web-based plotting tools to the scala console, while preserving an at-your-finger-tips feel readily found in matlab, R, and many other languages.
以前まではbreeze-vizを使って可視化していましたが,WISPに乗り換えてみました.
下の項目はクリックすると表示/非表示の切り替えが可能です.
詳しくは後述
環境
| 項目 | バージョン |
|---|---|
| sbt | 0.14.0 |
| scala | 2.11.8 |
| OS | OS X EI Capitan ver 10.11.6 |
導入
name := "WispSample"

version := "1.0"

scalaVersion := "2.11.8"

libraryDependencies ++= Seq(
  "com.quantifind" %% "wisp" % "0.0.4"
)
最小限しか書いていないので適時必要なものを追加してください.
とりあえずこのサンプルはこの構成で動きます.
構成は以下
.
├── build.sbt
├── project
│   └── target
├── src
│   └── main
│       └── scala
│           └── Wisp.scala
import com.quantifind.charts.Highcharts._

object Wisp{

  def main(args:Array[String]){
    // ここにいろいろ追加していく
  }
}
使い方
まずはどんな図が書けるのか見てみます.
scala> help

Available Plot Types: Takes an Iterable, an Iterable of pairs, a pair of Iterables, or an Iterable and a Function

	area
	areaspline
	bar
	column
	line
	pie
	scatter
	spline
	regression

Other plotting options:

	histogram                          Iterable of Numerics or Pairs
GitHubのWikiにて,areaspline,pie,regression,histogram,barの使い方は画像付きで紹介されていてわかりやすいです.
なので,今回は紹介されていないものを中心に紹介したいと思います.
Plot
コード
import com.quantifind.charts.Highcharts._

object Wisp{

  def main(args:Array[String]){
    //第1引数がx軸,第2引数がy軸
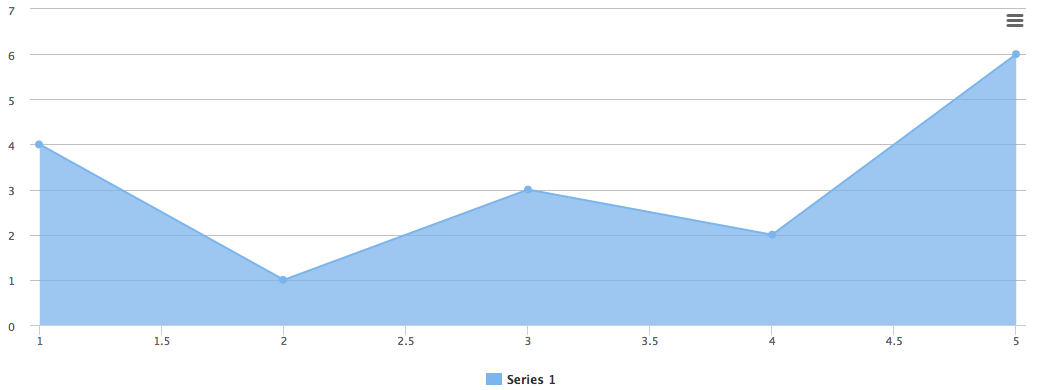
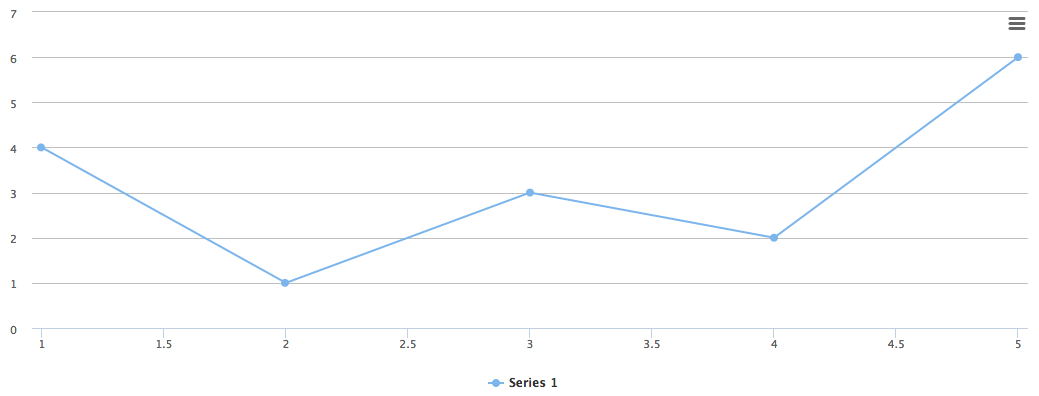
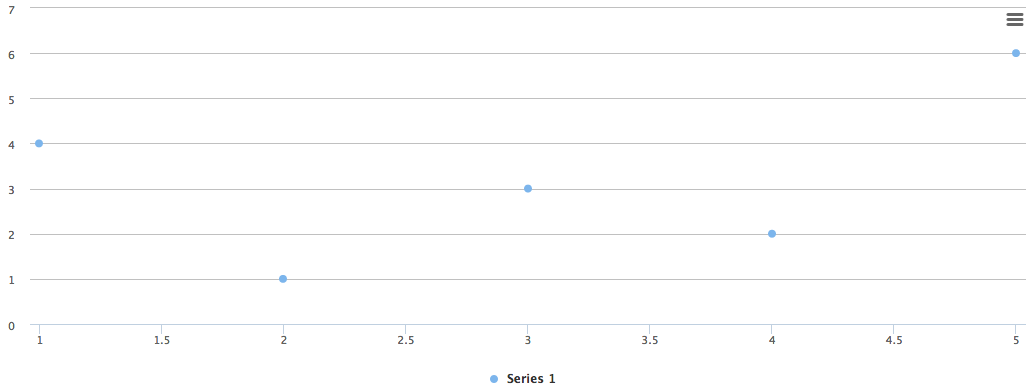
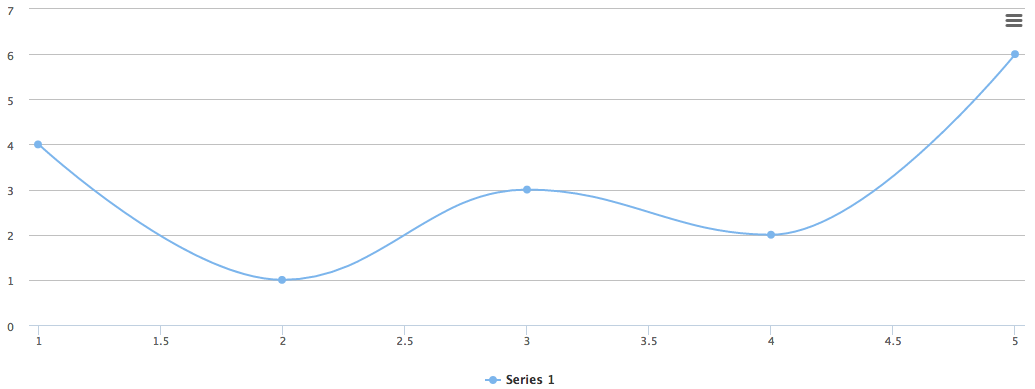
    area(List(1, 2, 3, 4, 5), List(4, 1, 3, 2, 6))
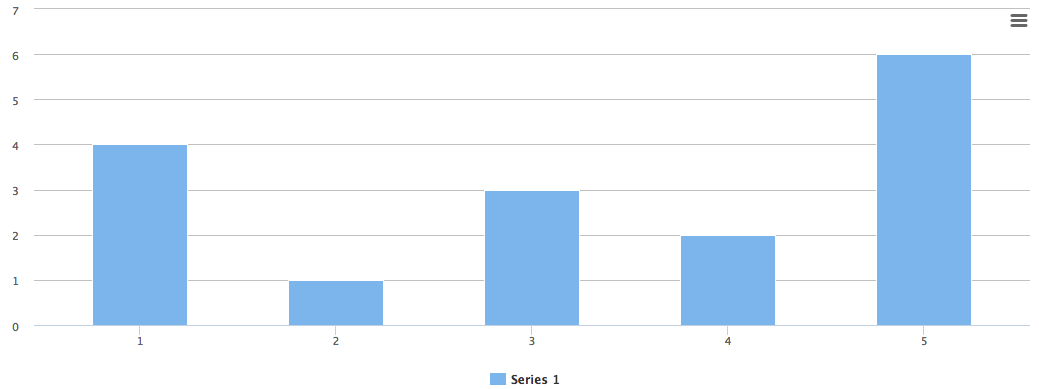
    column(List(1, 2, 3, 4, 5), List(4, 1, 3, 2, 6))
    line(List(1, 2, 3, 4, 5), List(4, 1, 3, 2, 6))
    scatter(List(1, 2, 3, 4, 5), List(4, 1, 3, 2, 6))
    spline(List(1, 2, 3, 4, 5), List(4, 1, 3, 2, 6))
  }
}
sbt runするとブラウザが起動して図が作成される.
図
説明のため,わけて載せましたが,ブラウザが起動した際に同じページに載っています.
引数で使用することが可能なのは
an Iterable[Numeric]
an Iterable[(Numeric, Numeric)]
an (Iterable[Numeric], Iterable[Numeric])
an (Iterable[Numeric], Numeric => Numeric)
an (Numeric => Numeric, Iterable[Numeric])
だそうです
Style調整を絡めて実践してみる
スタイルについてのオプションもいくつか用意されています.
Stylistic changes:

	hold                               plots the next plot on top of the existing plot
	unhold                             plots the next plot in a new chart
	title(String)                      add a title to the most recent plot
	xAxis(String)                      adds a label to the x-axis
	xAxisType([                        updates the x-axis type
	  "linear", "logarithmic",
	  "datetime", "category"
	])
	yAxis(String)                      adds a label to y-axis
	yAxisType([                        updates the y-axis type
	  "linear", "logarithmic",
	  "datetime", "category"
	])
	legend(Iterable[String])           adds a legend to the most recent plot
	stack(["normal", "percent"])       stacks bars, columns, and lines relative to each other
	unstack                            remove stacking
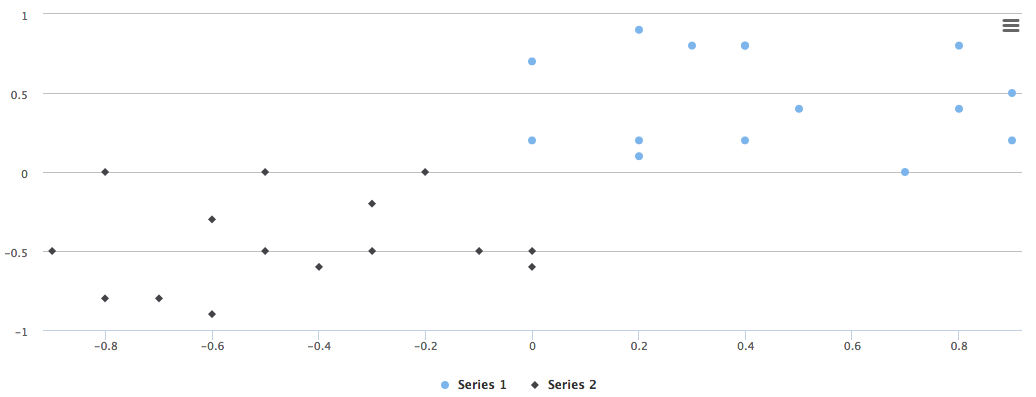
今回は先頭でのっけた図っぽいものを作ってみようと思います.
(計算とか一切しないでただ見た目だけ真似してみます.)
Step1 データをPlot
import com.quantifind.charts.Highcharts._

object Wisp{

  def main(args:Array[String]){
    //第1引数がx軸,第2引数がy軸
    // area(List(1, 2, 3, 4, 5), List(4, 1, 3, 2, 6))
    // column(List(1, 2, 3, 4, 5), List(4, 1, 3, 2, 6))
    // line(List(1, 2, 3, 4, 5), List(4, 1, 3, 2, 6))
    // scatter(List(1, 2, 3, 4, 5), List(4, 1, 3, 2, 6))
    // spline(List(1, 2, 3, 4, 5), List(4, 1, 3, 2, 6))

    //第1象限のデータ
    //第1象限のデータ
    val xFirstQuadrant:List[Double] = List.fill(15)(Random.nextInt(10)).map{_ / 10.0}
    val yFirstQuadrant:List[Double] = List.fill(15)(Random.nextInt(10)).map{_ / 10.0}
    scatter(xFirstQuadrant,yFirstQuadrant)

    //第3象限データ
    val xThirdQuadrant:List[Double] = List.fill(15)(Random.nextInt(10)).map{_ / -10.0}
    val yThirdQuadrant:List[Double] = List.fill(15)(Random.nextInt(10)).map{_ / -10.0}
    scatter(xThirdQuadrant,yThirdQuadrant)
    }
}
このままPlotすると2つグラフができてしまって狙いどおりにいかない.
なので,どんどん上書きしたいときはholdを使う
import com.quantifind.charts.Highcharts._

object Wisp{

  def main(args:Array[String]){
    //第1引数がx軸,第2引数がy軸
    // area(List(1, 2, 3, 4, 5), List(4, 1, 3, 2, 6))
    // column(List(1, 2, 3, 4, 5), List(4, 1, 3, 2, 6))
    // line(List(1, 2, 3, 4, 5), List(4, 1, 3, 2, 6))
    // scatter(List(1, 2, 3, 4, 5), List(4, 1, 3, 2, 6))
    // spline(List(1, 2, 3, 4, 5), List(4, 1, 3, 2, 6))

    //第1象限のデータ
    //第1象限のデータ
    val xFirstQuadrant:List[Double] = List.fill(15)(Random.nextInt(10)).map{_ / 10.0}
    val yFirstQuadrant:List[Double] = List.fill(15)(Random.nextInt(10)).map{_ / 10.0}
    scatter(xFirstQuadrant,yFirstQuadrant)
    hold

    //第3象限データ
    val xThirdQuadrant:List[Double] = List.fill(15)(Random.nextInt(10)).map{_ / -10.0}
    val yThirdQuadrant:List[Double] = List.fill(15)(Random.nextInt(10)).map{_ / -10.0}
    scatter(xThirdQuadrant,yThirdQuadrant)
    }
}
Step2 境界線を引いてみる
import com.quantifind.charts.Highcharts._

object Wisp{

  def main(args:Array[String]){
    //第1引数がx軸,第2引数がy軸
    // area(List(1, 2, 3, 4, 5), List(4, 1, 3, 2, 6))
    // column(List(1, 2, 3, 4, 5), List(4, 1, 3, 2, 6))
    // line(List(1, 2, 3, 4, 5), List(4, 1, 3, 2, 6))
    // scatter(List(1, 2, 3, 4, 5), List(4, 1, 3, 2, 6))
    // spline(List(1, 2, 3, 4, 5), List(4, 1, 3, 2, 6))

    //第1象限のデータ
    //第1象限のデータ
    val xFirstQuadrant:List[Double] = List.fill(15)(Random.nextInt(10)).map{_ / 10.0}
    val yFirstQuadrant:List[Double] = List.fill(15)(Random.nextInt(10)).map{_ / 10.0}
    scatter(xFirstQuadrant,yFirstQuadrant)
    hold

    //第3象限データ
    val xThirdQuadrant:List[Double] = List.fill(15)(Random.nextInt(10)).map{_ / -10.0}
    val yThirdQuadrant:List[Double] = List.fill(15)(Random.nextInt(10)).map{_ / -10.0}
    scatter(xThirdQuadrant,yThirdQuadrant)
    hold
    line((-1 to 1).map(x => x -> -x))
    }
}
mapを使うと引数は1つでも大丈夫です.
Step3 エイリアスを付ける
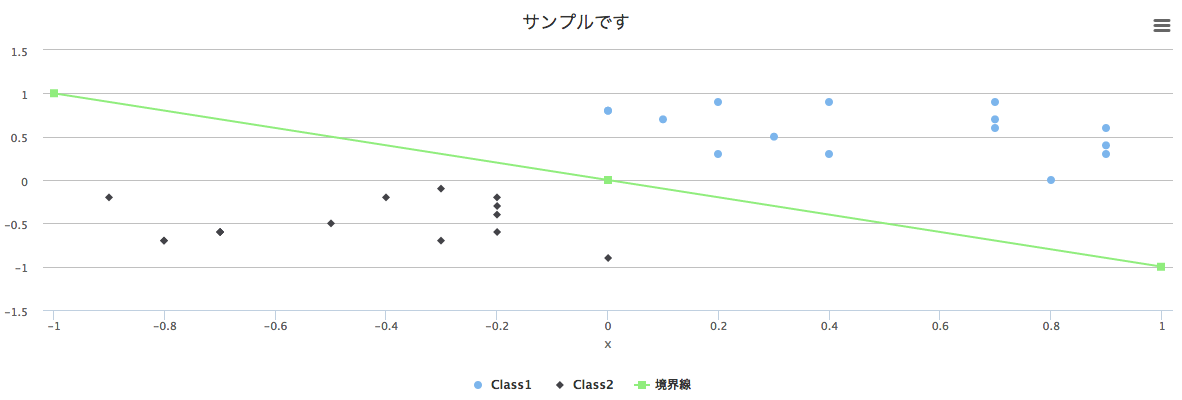
上記の図のままだと何が何を表しているのかわからないのでエイリアスをつけていきましょう
| スタイルオプション | 説明 |
|---|---|
| title | タイトル |
| xAxis | x軸のラベル |
| yAxis | y軸のラベル |
| legend | データのラベル |
となっています.
import com.quantifind.charts.Highcharts._

object Wisp{

  def main(args:Array[String]){
    //第1引数がx軸,第2引数がy軸
    // area(List(1, 2, 3, 4, 5), List(4, 1, 3, 2, 6))
    // column(List(1, 2, 3, 4, 5), List(4, 1, 3, 2, 6))
    // line(List(1, 2, 3, 4, 5), List(4, 1, 3, 2, 6))
    // scatter(List(1, 2, 3, 4, 5), List(4, 1, 3, 2, 6))
    // spline(List(1, 2, 3, 4, 5), List(4, 1, 3, 2, 6))

    //第1象限のデータ
    //第1象限のデータ
    val xFirstQuadrant:List[Double] = List.fill(15)(Random.nextInt(10)).map{_ / 10.0}
    val yFirstQuadrant:List[Double] = List.fill(15)(Random.nextInt(10)).map{_ / 10.0}
    scatter(xFirstQuadrant,yFirstQuadrant)
    hold

    //第3象限データ
    val xThirdQuadrant:List[Double] = List.fill(15)(Random.nextInt(10)).map{_ / -10.0}
    val yThirdQuadrant:List[Double] = List.fill(15)(Random.nextInt(10)).map{_ / -10.0}
    scatter(xThirdQuadrant,yThirdQuadrant)
    hold
    line((-1 to 1).map(x => x -> -x))

    title("サンプルです")
    xAxis("x")
    yAxis("y")
    legend(List("Class1", "Class2", "境界線"))
    }
}
これでそれっぽくなりましたね.
Step4: ブラウザでみてみる
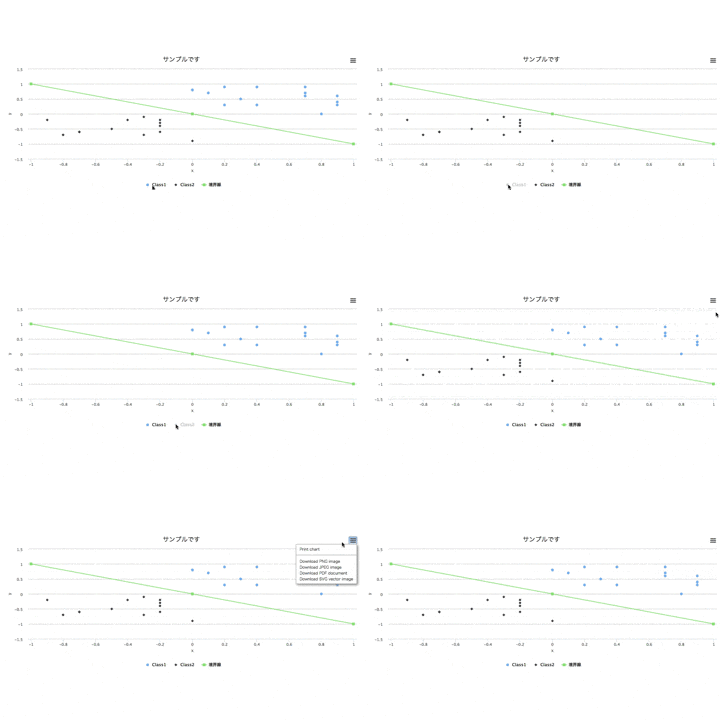
ブラウザでみると上の動画のように必要なものだけ表示したり,いろいろな形式でダウンロードすることができます.

