目的
統計ソフトSTATAのoutreg2を用いて、変数の基本統計量(データ数平均、標準偏差、最大値、最小値)を論文に載っているようなきれいな表に出力する。
環境
- STATA13.0
サンプルコード
outreg2をインストール(すでにインストールされている場合はこの手順をスキップ)
ssc install outreg2
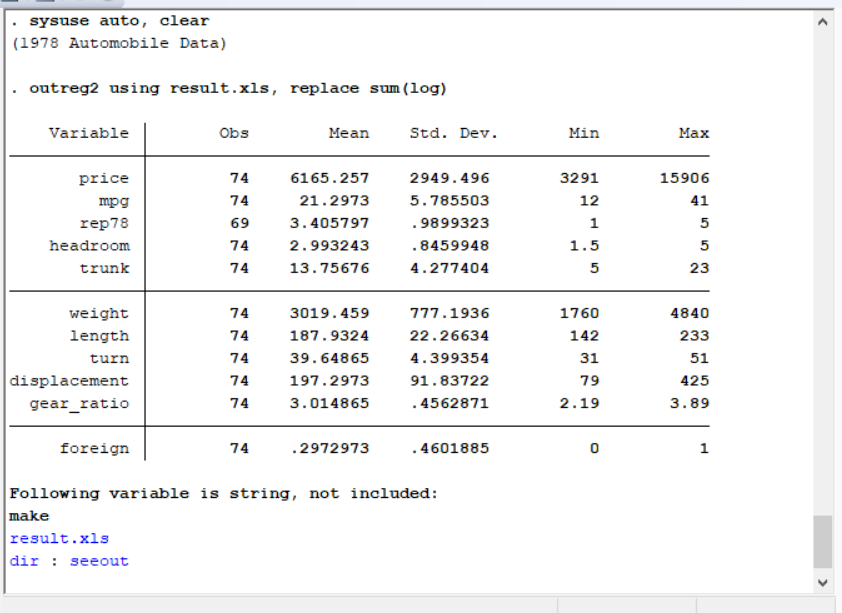
使うファイルを指定。(今回はサンプルデータを利用するためsysuse...としてある点に注意。)
sysuse auto, clear
result.xlsファイルに表を出力
※Wordファイルに出力したい場合は、拡張子を.docに変更すれば可能。
outreg2 using result.xls, replace sum(log)
下記画像のような結果が得られたら、windowsユーザーの人は、画像下部の青いresult.xlsをクリック。
※macユーザーはdir: seeoutをクリック(たぶん…)
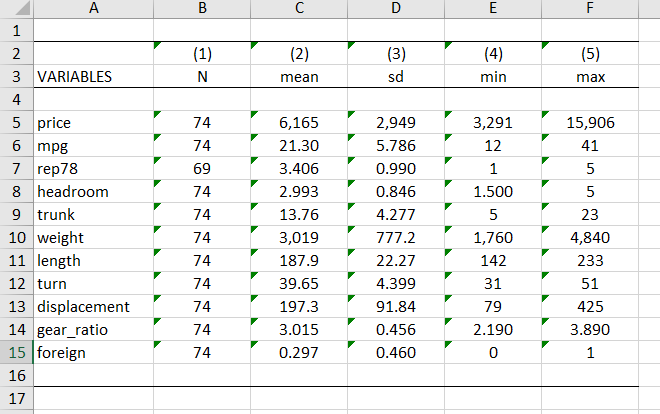
結果
excelで見ると下記画像のような感じ。
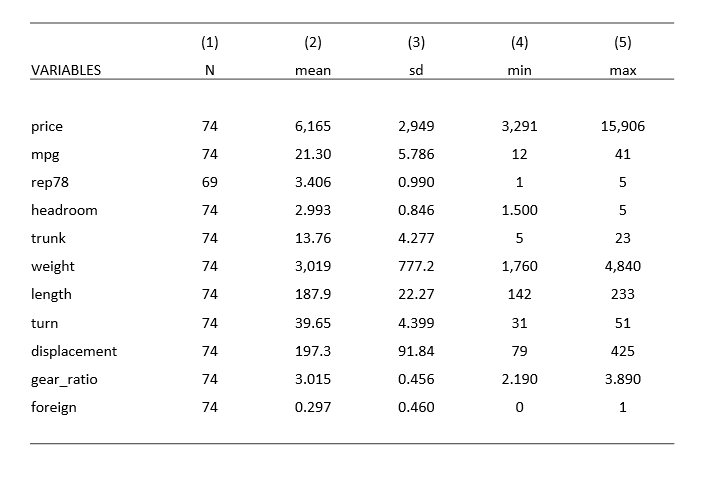
パワポなどに張り付けると下記画像のような感じ。
追記
以下のようにオプションにkeep(任意の変数名)と付け加えることで、任意の変数のみで表を作成できる。
outreg2 using result2.xls, replace sum(log) keep(変数1 変数2 変数3)