海外のyoutuberのKeith Galliという方のPythonのレクチャー動画を見てワークをやってみました。
【PythonのPandasライブラリを用いて現実のデータサイエンス課題を解いてみよう!】
Solving real world data science tasks with Python Pandas!
難易度は高くなく、平易な英語なので是非ご覧ください。
1時間半ほどの動画です。非常に丁寧な説明です。
Googleでstackoverflow(海外版プログラミングQ&Aサイト)で、
解決法を調べる過程なども見せてくれています。
CSVのエクセルデータを用いて分析するタスクになります。
データは彼のGithubからダウンロード出来ます。
私はjupyter notebookで実行しています。
コードに補足を日本語で入れながらやっています。
動画をみて、実際に触ってみたらPandasの練習に最適かと思います。
この記事に目を通すだけでもだいたい雰囲気はつかめると思います。
データの読み込みからデータフレーム作成
pandas,osライブラリを読み込む
import pandas as pd
import os
まずどんなデータが入っているかを確認します(ファイル名一覧取得)
files = [file for file in os.listdir("Sales_Data")]
for file in files:
    print(file)
Sales_April_2019.csv
Sales_August_2019.csv
Sales_December_2019.csv
Sales_February_2019.csv
Sales_January_2019.csv
Sales_July_2019.csv
Sales_June_2019.csv
Sales_March_2019.csv
Sales_May_2019.csv
Sales_November_2019.csv
Sales_October_2019.csv
Sales_September_2019.csv
ファイル名から2019年1-12月までのデータが入っているようです、分析するためにデータをひとつにまとめたいです
まず、すべてのデータを格納するための空のデータフレームを作成します
all_months_data = pd.DataFrame()
すべての月データを合体させるために、それぞれの月のcsvファイルを空データフレームに次々にいれていきます
for file in files:
    df = pd.read_csv("Sales_Data/" + file)
    all_months_data = pd.concat([all_months_data,df])
さて、データの最初の5行はこんな感じです
all_months_data.head()
| Order ID | Product | Quantity Ordered | Price Each | Order Date | Purchase Address | |
|---|---|---|---|---|---|---|
| 0 | 176558 | USB-C Charging Cable | 2 | 11.95 | 04/19/19 08:46 | 917 1st St, Dallas, TX 75001 |
| 1 | NaN | NaN | NaN | NaN | NaN | NaN |
| 2 | 176559 | Bose SoundSport Headphones | 1 | 99.99 | 04/07/19 22:30 | 682 Chestnut St, Boston, MA 02215 |
| 3 | 176560 | Google Phone | 1 | 600 | 04/12/19 14:38 | 669 Spruce St, Los Angeles, CA 90001 |
| 4 | 176560 | Wired Headphones | 1 | 11.99 | 04/12/19 14:38 | 669 Spruce St, Los Angeles, CA 90001 |
合体したデータを出力します (このとき通し番号はいらないので、引数にindex=Falseを加えます)
all_months_data.to_csv("all_data.csv",index=False)
出力したデータを確認出来たら、合体したデータを改めて読み込んでみます
all_data = pd.read_csv("all_data.csv")
all_data.head()
| Order ID | Product | Quantity Ordered | Price Each | Order Date | Purchase Address | |
|---|---|---|---|---|---|---|
| 0 | 176558 | USB-C Charging Cable | 2 | 11.95 | 04/19/19 08:46 | 917 1st St, Dallas, TX 75001 |
| 1 | NaN | NaN | NaN | NaN | NaN | NaN |
| 2 | 176559 | Bose SoundSport Headphones | 1 | 99.99 | 04/07/19 22:30 | 682 Chestnut St, Boston, MA 02215 |
| 3 | 176560 | Google Phone | 1 | 600 | 04/12/19 14:38 | 669 Spruce St, Los Angeles, CA 90001 |
| 4 | 176560 | Wired Headphones | 1 | 11.99 | 04/12/19 14:38 | 669 Spruce St, Los Angeles, CA 90001 |
ワーク1:一番売り上げがあった月はいつで、どれぐらい稼いだでしょうか?
カラムをみてみると、Order Date=注文日の列はありますが、月だけのデータはないですので、新しく作りましょう
注文日の列の最初の2文字が月に当たるデータになりそうです
all_data['Month'] = all_data['Order Date'].str[0:2]
文字列化したので、もう一度数値に戻しておきましょう
all_data['Month'] = all_data['Month'].astype('int32')
all_data.head()
---------------------------------------------------------------------------

ValueError                                Traceback (most recent call last)

<ipython-input-77-ffc394ccb2ad> in <module>
----> 1 all_data['Month'] = all_data['Month'].astype('int32')
      2 all_data.head()


/opt/anaconda3/lib/python3.7/site-packages/pandas/core/generic.py in astype(self, dtype, copy, errors, **kwargs)
   5880             # else, only a single dtype is given
   5881             new_data = self._data.astype(
-> 5882                 dtype=dtype, copy=copy, errors=errors, **kwargs
   5883             )
   5884             return self._constructor(new_data).__finalize__(self)


/opt/anaconda3/lib/python3.7/site-packages/pandas/core/internals/managers.py in astype(self, dtype, **kwargs)
    579
    580     def astype(self, dtype, **kwargs):
--> 581         return self.apply("astype", dtype=dtype, **kwargs)
    582
    583     def convert(self, **kwargs):


/opt/anaconda3/lib/python3.7/site-packages/pandas/core/internals/managers.py in apply(self, f, axes, filter, do_integrity_check, consolidate, **kwargs)
    436                     kwargs[k] = obj.reindex(b_items, axis=axis, copy=align_copy)
    437
--> 438             applied = getattr(b, f)(**kwargs)
    439             result_blocks = _extend_blocks(applied, result_blocks)
    440


/opt/anaconda3/lib/python3.7/site-packages/pandas/core/internals/blocks.py in astype(self, dtype, copy, errors, values, **kwargs)
    557
    558     def astype(self, dtype, copy=False, errors="raise", values=None, **kwargs):
--> 559         return self._astype(dtype, copy=copy, errors=errors, values=values, **kwargs)
    560
    561     def _astype(self, dtype, copy=False, errors="raise", values=None, **kwargs):


/opt/anaconda3/lib/python3.7/site-packages/pandas/core/internals/blocks.py in _astype(self, dtype, copy, errors, values, **kwargs)
    641                     # _astype_nansafe works fine with 1-d only
    642                     vals1d = values.ravel()
--> 643                     values = astype_nansafe(vals1d, dtype, copy=True, **kwargs)
    644
    645                 # TODO(extension)


/opt/anaconda3/lib/python3.7/site-packages/pandas/core/dtypes/cast.py in astype_nansafe(arr, dtype, copy, skipna)
    705         # work around NumPy brokenness, #1987
    706         if np.issubdtype(dtype.type, np.integer):
--> 707             return lib.astype_intsafe(arr.ravel(), dtype).reshape(arr.shape)
    708
    709         # if we have a datetime/timedelta array of objects


pandas/_libs/lib.pyx in pandas._libs.lib.astype_intsafe()


ValueError: cannot convert float NaN to integer
エラーが出てしまいました
エラー文を読むと、NaNを数値化することは出来ないよと言っています
is_na 関数とany関数を組み合わせると、1つでもNaNがあればTrueと返してくれます
axis = 1は行ごとに処理を返しくれる関数です
NaNを含む行をすべて返してもらいます
nan_df = all_data[all_data.isna().any(axis=1)]
nan_df
| Order ID | Product | Quantity Ordered | Price Each | Order Date | Purchase Address | Month | |
|---|---|---|---|---|---|---|---|
| 1 | NaN | NaN | NaN | NaN | NaN | NaN | NaN |
| 356 | NaN | NaN | NaN | NaN | NaN | NaN | NaN |
| 735 | NaN | NaN | NaN | NaN | NaN | NaN | NaN |
| 1433 | NaN | NaN | NaN | NaN | NaN | NaN | NaN |
| 1553 | NaN | NaN | NaN | NaN | NaN | NaN | NaN |
| ... | ... | ... | ... | ... | ... | ... | ... |
| 185176 | NaN | NaN | NaN | NaN | NaN | NaN | NaN |
| 185438 | NaN | NaN | NaN | NaN | NaN | NaN | NaN |
| 186042 | NaN | NaN | NaN | NaN | NaN | NaN | NaN |
| 186548 | NaN | NaN | NaN | NaN | NaN | NaN | NaN |
| 186826 | NaN | NaN | NaN | NaN | NaN | NaN | NaN |
545 rows × 7 columns
545行もありました
NaNを含むデータを消しましょう
all_data = all_data.dropna(how='all')
all_data.head()
| Order ID | Product | Quantity Ordered | Price Each | Order Date | Purchase Address | Month | |
|---|---|---|---|---|---|---|---|
| 0 | 176558 | USB-C Charging Cable | 2 | 11.95 | 04/19/19 08:46 | 917 1st St, Dallas, TX 75001 | 04 |
| 2 | 176559 | Bose SoundSport Headphones | 1 | 99.99 | 04/07/19 22:30 | 682 Chestnut St, Boston, MA 02215 | 04 |
| 3 | 176560 | Google Phone | 1 | 600 | 04/12/19 14:38 | 669 Spruce St, Los Angeles, CA 90001 | 04 |
| 4 | 176560 | Wired Headphones | 1 | 11.99 | 04/12/19 14:38 | 669 Spruce St, Los Angeles, CA 90001 | 04 |
| 5 | 176561 | Wired Headphones | 1 | 11.99 | 04/30/19 09:27 | 333 8th St, Los Angeles, CA 90001 | 04 |
よしでは、先ほどの月を数値に戻すもう一度実行してみましょう
all_data['Month'] = all_data['Month'].astype('int32')
all_data.head()
---------------------------------------------------------------------------

ValueError                                Traceback (most recent call last)

<ipython-input-80-ffc394ccb2ad> in <module>
----> 1 all_data['Month'] = all_data['Month'].astype('int32')
      2 all_data.head()


/opt/anaconda3/lib/python3.7/site-packages/pandas/core/generic.py in astype(self, dtype, copy, errors, **kwargs)
   5880             # else, only a single dtype is given
   5881             new_data = self._data.astype(
-> 5882                 dtype=dtype, copy=copy, errors=errors, **kwargs
   5883             )
   5884             return self._constructor(new_data).__finalize__(self)


/opt/anaconda3/lib/python3.7/site-packages/pandas/core/internals/managers.py in astype(self, dtype, **kwargs)
    579
    580     def astype(self, dtype, **kwargs):
--> 581         return self.apply("astype", dtype=dtype, **kwargs)
    582
    583     def convert(self, **kwargs):


/opt/anaconda3/lib/python3.7/site-packages/pandas/core/internals/managers.py in apply(self, f, axes, filter, do_integrity_check, consolidate, **kwargs)
    436                     kwargs[k] = obj.reindex(b_items, axis=axis, copy=align_copy)
    437
--> 438             applied = getattr(b, f)(**kwargs)
    439             result_blocks = _extend_blocks(applied, result_blocks)
    440


/opt/anaconda3/lib/python3.7/site-packages/pandas/core/internals/blocks.py in astype(self, dtype, copy, errors, values, **kwargs)
    557
    558     def astype(self, dtype, copy=False, errors="raise", values=None, **kwargs):
--> 559         return self._astype(dtype, copy=copy, errors=errors, values=values, **kwargs)
    560
    561     def _astype(self, dtype, copy=False, errors="raise", values=None, **kwargs):


/opt/anaconda3/lib/python3.7/site-packages/pandas/core/internals/blocks.py in _astype(self, dtype, copy, errors, values, **kwargs)
    641                     # _astype_nansafe works fine with 1-d only
    642                     vals1d = values.ravel()
--> 643                     values = astype_nansafe(vals1d, dtype, copy=True, **kwargs)
    644
    645                 # TODO(extension)


/opt/anaconda3/lib/python3.7/site-packages/pandas/core/dtypes/cast.py in astype_nansafe(arr, dtype, copy, skipna)
    705         # work around NumPy brokenness, #1987
    706         if np.issubdtype(dtype.type, np.integer):
--> 707             return lib.astype_intsafe(arr.ravel(), dtype).reshape(arr.shape)
    708
    709         # if we have a datetime/timedelta array of objects


pandas/_libs/lib.pyx in pandas._libs.lib.astype_intsafe()


ValueError: invalid literal for int() with base 10: 'Or'
次は、また新しいエラーが出ています
'Or'という文言が含まれていたっぽいですね
'Or'が含まれている行を見てみましょう
temp_df = all_data[all_data['Order Date'].str[0:2] == "Or"]
temp_df.head()
| Order ID | Product | Quantity Ordered | Price Each | Order Date | Purchase Address | Month | |
|---|---|---|---|---|---|---|---|
| 519 | Order ID | Product | Quantity Ordered | Price Each | Order Date | Purchase Address | Or |
| 1149 | Order ID | Product | Quantity Ordered | Price Each | Order Date | Purchase Address | Or |
| 1155 | Order ID | Product | Quantity Ordered | Price Each | Order Date | Purchase Address | Or |
| 2878 | Order ID | Product | Quantity Ordered | Price Each | Order Date | Purchase Address | Or |
| 2893 | Order ID | Product | Quantity Ordered | Price Each | Order Date | Purchase Address | Or |
"Or"の正体は"Order Date"だったみたいですね。
"Order Date"という文言が含まれたデータ以外を抜き出してデータをリフレッシュしましょう
all_data = all_data[all_data['Order Date'].str[0:2] != "Or"]
all_data.head()
| Order ID | Product | Quantity Ordered | Price Each | Order Date | Purchase Address | Month | |
|---|---|---|---|---|---|---|---|
| 0 | 176558 | USB-C Charging Cable | 2 | 11.95 | 04/19/19 08:46 | 917 1st St, Dallas, TX 75001 | 04 |
| 2 | 176559 | Bose SoundSport Headphones | 1 | 99.99 | 04/07/19 22:30 | 682 Chestnut St, Boston, MA 02215 | 04 |
| 3 | 176560 | Google Phone | 1 | 600 | 04/12/19 14:38 | 669 Spruce St, Los Angeles, CA 90001 | 04 |
| 4 | 176560 | Wired Headphones | 1 | 11.99 | 04/12/19 14:38 | 669 Spruce St, Los Angeles, CA 90001 | 04 |
| 5 | 176561 | Wired Headphones | 1 | 11.99 | 04/30/19 09:27 | 333 8th St, Los Angeles, CA 90001 | 04 |
では3度目の正直で、数値化を実行してみましょう
all_data['Month'] = all_data['Order Date'].str[0:2]
all_data['Month'] = all_data['Month'].astype('int32')
all_data.head()
| Order ID | Product | Quantity Ordered | Price Each | Order Date | Purchase Address | Month | |
|---|---|---|---|---|---|---|---|
| 0 | 176558 | USB-C Charging Cable | 2 | 11.95 | 04/19/19 08:46 | 917 1st St, Dallas, TX 75001 | 4 |
| 2 | 176559 | Bose SoundSport Headphones | 1 | 99.99 | 04/07/19 22:30 | 682 Chestnut St, Boston, MA 02215 | 4 |
| 3 | 176560 | Google Phone | 1 | 600 | 04/12/19 14:38 | 669 Spruce St, Los Angeles, CA 90001 | 4 |
| 4 | 176560 | Wired Headphones | 1 | 11.99 | 04/12/19 14:38 | 669 Spruce St, Los Angeles, CA 90001 | 4 |
| 5 | 176561 | Wired Headphones | 1 | 11.99 | 04/30/19 09:27 | 333 8th St, Los Angeles, CA 90001 | 4 |
いけました
次に、Quantity Ordered と Price Each はあるものの肝心の売り上げがありません
PQ(売り上げ) = P(価格) × Q(数量) なので PQに当たる列を追加します
all_data['Sales'] = all_data['Quantity Ordered'] * all_data['Price Each']
---------------------------------------------------------------------------

TypeError                                 Traceback (most recent call last)

/opt/anaconda3/lib/python3.7/site-packages/pandas/core/ops/__init__.py in na_op(x, y)
    967         try:
--> 968             result = expressions.evaluate(op, str_rep, x, y, **eval_kwargs)
    969         except TypeError:


/opt/anaconda3/lib/python3.7/site-packages/pandas/core/computation/expressions.py in evaluate(op, op_str, a, b, use_numexpr, **eval_kwargs)
    220     if use_numexpr:
--> 221         return _evaluate(op, op_str, a, b, **eval_kwargs)
    222     return _evaluate_standard(op, op_str, a, b)


/opt/anaconda3/lib/python3.7/site-packages/pandas/core/computation/expressions.py in _evaluate_numexpr(op, op_str, a, b, truediv, reversed, **eval_kwargs)
    126     if result is None:
--> 127         result = _evaluate_standard(op, op_str, a, b)
    128


/opt/anaconda3/lib/python3.7/site-packages/pandas/core/computation/expressions.py in _evaluate_standard(op, op_str, a, b, **eval_kwargs)
     69     with np.errstate(all="ignore"):
---> 70         return op(a, b)
     71


TypeError: can't multiply sequence by non-int of type 'str'


During handling of the above exception, another exception occurred:


TypeError                                 Traceback (most recent call last)

<ipython-input-84-7c1e2b69cbe2> in <module>
----> 1 all_data['Sales'] = all_data['Quantity Ordered'] * all_data['Price Each']


/opt/anaconda3/lib/python3.7/site-packages/pandas/core/ops/__init__.py in wrapper(left, right)
   1046
   1047         with np.errstate(all="ignore"):
-> 1048             result = na_op(lvalues, rvalues)
   1049         return construct_result(
   1050             left, result, index=left.index, name=res_name, dtype=None


/opt/anaconda3/lib/python3.7/site-packages/pandas/core/ops/__init__.py in na_op(x, y)
    968             result = expressions.evaluate(op, str_rep, x, y, **eval_kwargs)
    969         except TypeError:
--> 970             result = masked_arith_op(x, y, op)
    971
    972         return missing.dispatch_fill_zeros(op, x, y, result)


/opt/anaconda3/lib/python3.7/site-packages/pandas/core/ops/__init__.py in masked_arith_op(x, y, op)
    445         if mask.any():
    446             with np.errstate(all="ignore"):
--> 447                 result[mask] = op(xrav[mask], com.values_from_object(yrav[mask]))
    448
    449     else:


TypeError: can't multiply sequence by non-int of type 'str'
またしても、文字列が入っていました
とりあえず計算が出来る形に書き換えてあげたいので、"to_numeric"関数を使います
all_data['Quantity Ordered'] = pd.to_numeric(all_data['Quantity Ordered'])
all_data['Price Each'] = pd.to_numeric(all_data['Price Each'])
もう一回やってみます
all_data['Sales'] = all_data['Quantity Ordered'] * all_data['Price Each']
all_data.head()
| Order ID | Product | Quantity Ordered | Price Each | Order Date | Purchase Address | Month | Sales | |
|---|---|---|---|---|---|---|---|---|
| 0 | 176558 | USB-C Charging Cable | 2 | 11.95 | 04/19/19 08:46 | 917 1st St, Dallas, TX 75001 | 4 | 23.90 |
| 2 | 176559 | Bose SoundSport Headphones | 1 | 99.99 | 04/07/19 22:30 | 682 Chestnut St, Boston, MA 02215 | 4 | 99.99 |
| 3 | 176560 | Google Phone | 1 | 600.00 | 04/12/19 14:38 | 669 Spruce St, Los Angeles, CA 90001 | 4 | 600.00 |
| 4 | 176560 | Wired Headphones | 1 | 11.99 | 04/12/19 14:38 | 669 Spruce St, Los Angeles, CA 90001 | 4 | 11.99 |
| 5 | 176561 | Wired Headphones | 1 | 11.99 | 04/30/19 09:27 | 333 8th St, Los Angeles, CA 90001 | 4 | 11.99 |
出ましたね。やっと問いに対する答えが出そうです
一応、問いを再掲しておきます。
ワーク1:一番売り上げがあった月はいつで、どれぐらい稼いだでしょうか?
all_data.groupby('Month').sum()
| Quantity Ordered | Price Each | Sales | |
|---|---|---|---|
| Month | |||
| 1 | 10903 | 1.811768e+06 | 1.822257e+06 |
| 2 | 13449 | 2.188885e+06 | 2.202022e+06 |
| 3 | 17005 | 2.791208e+06 | 2.807100e+06 |
| 4 | 20558 | 3.367671e+06 | 3.390670e+06 |
| 5 | 18667 | 3.135125e+06 | 3.152607e+06 |
| 6 | 15253 | 2.562026e+06 | 2.577802e+06 |
| 7 | 16072 | 2.632540e+06 | 2.647776e+06 |
| 8 | 13448 | 2.230345e+06 | 2.244468e+06 |
| 9 | 13109 | 2.084992e+06 | 2.097560e+06 |
| 10 | 22703 | 3.715555e+06 | 3.736727e+06 |
| 11 | 19798 | 3.180601e+06 | 3.199603e+06 |
| 12 | 28114 | 4.588415e+06 | 4.613443e+06 |
パット見分からないので図示しましょう
図示する用のライブラリをインストールします
import matplotlib.pyplot as plt
X軸用の範囲も決めながらグラフ化します
months = range(1,13)
results = all_data.groupby('Month').sum()
plt.bar(months,results['Sales'])
plt.xticks(months)
plt.xlabel('Month')
plt.ylabel('Sales')
plt.show()
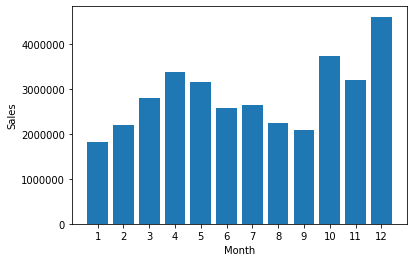
以上がワーク1でした。
ワーク2:どの都市が一番の売り上げだったか
売り上げの列を作った今、簡単そうなワークですが、やってみましょう
その前に、改めて、データがどんなものだったかを確認します
all_data.head()
| Order ID | Product | Quantity Ordered | Price Each | Order Date | Purchase Address | Month | Sales | |
|---|---|---|---|---|---|---|---|---|
| 0 | 176558 | USB-C Charging Cable | 2 | 11.95 | 04/19/19 08:46 | 917 1st St, Dallas, TX 75001 | 4 | 23.90 |
| 2 | 176559 | Bose SoundSport Headphones | 1 | 99.99 | 04/07/19 22:30 | 682 Chestnut St, Boston, MA 02215 | 4 | 99.99 |
| 3 | 176560 | Google Phone | 1 | 600.00 | 04/12/19 14:38 | 669 Spruce St, Los Angeles, CA 90001 | 4 | 600.00 |
| 4 | 176560 | Wired Headphones | 1 | 11.99 | 04/12/19 14:38 | 669 Spruce St, Los Angeles, CA 90001 | 4 | 11.99 |
| 5 | 176561 | Wired Headphones | 1 | 11.99 | 04/30/19 09:27 | 333 8th St, Los Angeles, CA 90001 | 4 | 11.99 |
Purchase Addressの部分のデータの一部を抜き取って、集計する感じでしょうかね
ではSalesの時と同様に、City列を作りましょう
Addressの一部を抜き出さないといけないですが、Adressのデータをみると、"番地,都市名,郵便番号"という感じで、2個目の都市名だけを取り出したいです。
split関数で","で分けること、とそれを同じ列のすべての列で適用するためにapply関数を使いましょう
all_data['City'] = all_data['Purchase Address'].apply(lambda x: x.split(',')[1])
all_data.head()
| Order ID | Product | Quantity Ordered | Price Each | Order Date | Purchase Address | Month | Sales | City | |
|---|---|---|---|---|---|---|---|---|---|
| 0 | 176558 | USB-C Charging Cable | 2 | 11.95 | 04/19/19 08:46 | 917 1st St, Dallas, TX 75001 | 4 | 23.90 | Dallas |
| 2 | 176559 | Bose SoundSport Headphones | 1 | 99.99 | 04/07/19 22:30 | 682 Chestnut St, Boston, MA 02215 | 4 | 99.99 | Boston |
| 3 | 176560 | Google Phone | 1 | 600.00 | 04/12/19 14:38 | 669 Spruce St, Los Angeles, CA 90001 | 4 | 600.00 | Los Angeles |
| 4 | 176560 | Wired Headphones | 1 | 11.99 | 04/12/19 14:38 | 669 Spruce St, Los Angeles, CA 90001 | 4 | 11.99 | Los Angeles |
| 5 | 176561 | Wired Headphones | 1 | 11.99 | 04/30/19 09:27 | 333 8th St, Los Angeles, CA 90001 | 4 | 11.99 | Los Angeles |
Cityだけうまくわけられましたね!
さて、Cityで集計する際に、ここでひとつ考えないといけない問題があります。
それは、Cityといっても、同じ名前のCityだけど他の国にも同じ名前があるケースです。これを考慮しないと、合算されてしまい意図しない集計結果が出てしまいます。(例:オレゴン州とメイン州の両方にあるポートランド)
とはいえ、国名として新しく列を作る必要はありません。集計するだけなので、Cityの列のセルにState(2文字)も収めるだけでいいです。今回は、City(State)という形にします。 ex: Dallas(TX)
さきほど、lambda関数で一行で書いてしまいましたが、せっかくなので、都市名、国名をそれぞれ取得する関数を作りましょう。読み手にも親切です。
def get_city(address):
    return address.split(',')[1]

def get_state(address):
    return address.split(',')[2].split(' ')[1]
# Purchaseアドレスのデータはコンマ(,)のあと空白(" ")があるので、合体したときに不自然にならないようにsplitで削る

all_data['City'] = all_data['Purchase Address'].apply(lambda x: f"{get_city(x)} ({get_state(x)})")
all_data.drop("State",axis=1)
| Order ID | Product | Quantity Ordered | Price Each | Order Date | Purchase Address | Month | Sales | City | |
|---|---|---|---|---|---|---|---|---|---|
| 0 | 176558 | USB-C Charging Cable | 2 | 11.95 | 04/19/19 08:46 | 917 1st St, Dallas, TX 75001 | 4 | 23.90 | Dallas (TX) |
| 2 | 176559 | Bose SoundSport Headphones | 1 | 99.99 | 04/07/19 22:30 | 682 Chestnut St, Boston, MA 02215 | 4 | 99.99 | Boston (MA) |
| 3 | 176560 | Google Phone | 1 | 600.00 | 04/12/19 14:38 | 669 Spruce St, Los Angeles, CA 90001 | 4 | 600.00 | Los Angeles (CA) |
| 4 | 176560 | Wired Headphones | 1 | 11.99 | 04/12/19 14:38 | 669 Spruce St, Los Angeles, CA 90001 | 4 | 11.99 | Los Angeles (CA) |
| 5 | 176561 | Wired Headphones | 1 | 11.99 | 04/30/19 09:27 | 333 8th St, Los Angeles, CA 90001 | 4 | 11.99 | Los Angeles (CA) |
| ... | ... | ... | ... | ... | ... | ... | ... | ... | ... |
| 186845 | 259353 | AAA Batteries (4-pack) | 3 | 2.99 | 09/17/19 20:56 | 840 Highland St, Los Angeles, CA 90001 | 9 | 8.97 | Los Angeles (CA) |
| 186846 | 259354 | iPhone | 1 | 700.00 | 09/01/19 16:00 | 216 Dogwood St, San Francisco, CA 94016 | 9 | 700.00 | San Francisco (CA) |
| 186847 | 259355 | iPhone | 1 | 700.00 | 09/23/19 07:39 | 220 12th St, San Francisco, CA 94016 | 9 | 700.00 | San Francisco (CA) |
| 186848 | 259356 | 34in Ultrawide Monitor | 1 | 379.99 | 09/19/19 17:30 | 511 Forest St, San Francisco, CA 94016 | 9 | 379.99 | San Francisco (CA) |
| 186849 | 259357 | USB-C Charging Cable | 1 | 11.95 | 09/30/19 00:18 | 250 Meadow St, San Francisco, CA 94016 | 9 | 11.95 | San Francisco (CA) |
185950 rows × 9 columns
OKです、あとは普通に集計すればいいだけですね
all_data.groupby('City').sum()
| Quantity Ordered | Price Each | Month | Sales | |
|---|---|---|---|---|
| City | ||||
| Atlanta (GA) | 16602 | 2.779908e+06 | 104794 | 2.795499e+06 |
| Austin (TX) | 11153 | 1.809874e+06 | 69829 | 1.819582e+06 |
| Boston (MA) | 22528 | 3.637410e+06 | 141112 | 3.661642e+06 |
| Dallas (TX) | 16730 | 2.752628e+06 | 104620 | 2.767975e+06 |
| Los Angeles (CA) | 33289 | 5.421435e+06 | 208325 | 5.452571e+06 |
| New York City (NY) | 27932 | 4.635371e+06 | 175741 | 4.664317e+06 |
| Portland (ME) | 2750 | 4.471893e+05 | 17144 | 4.497583e+05 |
| Portland (OR) | 11303 | 1.860558e+06 | 70621 | 1.870732e+06 |
| San Francisco (CA) | 50239 | 8.211462e+06 | 315520 | 8.262204e+06 |
| Seattle (WA) | 16553 | 2.733296e+06 | 104941 | 2.747755e+06 |
San Franciscoが一位です。あと、Portlandもちゃんとわけられていることがわかります。
さっきのmonthで使ったコードをアレンジして
results = all_data.groupby('City').sum()
cities = [city for city, df in all_data.groupby('City')]
# x軸ラベル用のcity:上記でgroubbyしたときと同じ並び順にしないと数字とラベルがバラバラになる
plt.bar(cities,results['Sales'])
plt.xticks(cities,rotation="vertical")
# citiesをそのまま表示したらかさばってしまうので垂直表示に
plt.ylabel('Sales')
plt.xlabel('City name')
plt.show()

できました!
ワーク3:顧客が商品を買う見込みを最大化するためにいつ・どの時間に広告を打つ(ディスプレイする)べきでしょうか?
一気にワークがデータサイエンスっぽくなりましたね (ただ、結論を先に言うとそこまで厳密なロジックではないです)
さて、いつも通り、データを振り返ってみましょう
all_data.head()
| Order ID | Product | Quantity Ordered | Price Each | Order Date | Purchase Address | Month | Sales | City | State | |
|---|---|---|---|---|---|---|---|---|---|---|
| 0 | 176558 | USB-C Charging Cable | 2 | 11.95 | 04/19/19 08:46 | 917 1st St, Dallas, TX 75001 | 4 | 23.90 | Dallas (TX) | TX 75001 |
| 2 | 176559 | Bose SoundSport Headphones | 1 | 99.99 | 04/07/19 22:30 | 682 Chestnut St, Boston, MA 02215 | 4 | 99.99 | Boston (MA) | MA 02215 |
| 3 | 176560 | Google Phone | 1 | 600.00 | 04/12/19 14:38 | 669 Spruce St, Los Angeles, CA 90001 | 4 | 600.00 | Los Angeles (CA) | CA 90001 |
| 4 | 176560 | Wired Headphones | 1 | 11.99 | 04/12/19 14:38 | 669 Spruce St, Los Angeles, CA 90001 | 4 | 11.99 | Los Angeles (CA) | CA 90001 |
| 5 | 176561 | Wired Headphones | 1 | 11.99 | 04/30/19 09:27 | 333 8th St, Los Angeles, CA 90001 | 4 | 11.99 | Los Angeles (CA) | CA 90001 |
おそらく、Order Dataの列とSales列の関連性をみるとよさそうです
Order Dateを日付データとして扱いやすいようにデータの型を変えてみましょう
all_data['Order Date'] = pd.to_datetime(all_data['Order Date'])
all_data.head()
| Order ID | Product | Quantity Ordered | Price Each | Order Date | Purchase Address | Month | Sales | City | State | |
|---|---|---|---|---|---|---|---|---|---|---|
| 0 | 176558 | USB-C Charging Cable | 2 | 11.95 | 2019-04-19 08:46:00 | 917 1st St, Dallas, TX 75001 | 4 | 23.90 | Dallas (TX) | TX 75001 |
| 2 | 176559 | Bose SoundSport Headphones | 1 | 99.99 | 2019-04-07 22:30:00 | 682 Chestnut St, Boston, MA 02215 | 4 | 99.99 | Boston (MA) | MA 02215 |
| 3 | 176560 | Google Phone | 1 | 600.00 | 2019-04-12 14:38:00 | 669 Spruce St, Los Angeles, CA 90001 | 4 | 600.00 | Los Angeles (CA) | CA 90001 |
| 4 | 176560 | Wired Headphones | 1 | 11.99 | 2019-04-12 14:38:00 | 669 Spruce St, Los Angeles, CA 90001 | 4 | 11.99 | Los Angeles (CA) | CA 90001 |
| 5 | 176561 | Wired Headphones | 1 | 11.99 | 2019-04-30 09:27:00 | 333 8th St, Los Angeles, CA 90001 | 4 | 11.99 | Los Angeles (CA) | CA 90001 |
データの形式が変わりましたね
Hour,Minuteの列を作りましょう
MonthやSalesで列を作るときは文字列だったので、Splitなどを使っていましたが、先ほどデータの型を変えたおかげで
all_data['Hour'] = all_data['Order Date'].dt.hour
all_data['Minute'] = all_data['Order Date'].dt.minute
all_data.head()
| Order ID | Product | Quantity Ordered | Price Each | Order Date | Purchase Address | Month | Sales | City | State | Hour | Minute | |
|---|---|---|---|---|---|---|---|---|---|---|---|---|
| 0 | 176558 | USB-C Charging Cable | 2 | 11.95 | 2019-04-19 08:46:00 | 917 1st St, Dallas, TX 75001 | 4 | 23.90 | Dallas (TX) | TX 75001 | 8 | 46 |
| 2 | 176559 | Bose SoundSport Headphones | 1 | 99.99 | 2019-04-07 22:30:00 | 682 Chestnut St, Boston, MA 02215 | 4 | 99.99 | Boston (MA) | MA 02215 | 22 | 30 |
| 3 | 176560 | Google Phone | 1 | 600.00 | 2019-04-12 14:38:00 | 669 Spruce St, Los Angeles, CA 90001 | 4 | 600.00 | Los Angeles (CA) | CA 90001 | 14 | 38 |
| 4 | 176560 | Wired Headphones | 1 | 11.99 | 2019-04-12 14:38:00 | 669 Spruce St, Los Angeles, CA 90001 | 4 | 11.99 | Los Angeles (CA) | CA 90001 | 14 | 38 |
| 5 | 176561 | Wired Headphones | 1 | 11.99 | 2019-04-30 09:27:00 | 333 8th St, Los Angeles, CA 90001 | 4 | 11.99 | Los Angeles (CA) | CA 90001 | 9 | 27 |
一旦データを把握するために可視化しましょう
hours = [hour for hour, df in all_data.groupby('Hour')]
plt.plot(hours,all_data.groupby(['Hour']).count())
# 時間をX軸に、時間ごとにOrder数(行数)を集計する
plt.xticks(hours)
plt.grid()
# 出来るだけ時間ごとの明確な傾向が見たいのでGridをつける
plt.xlabel('Hour')
plt.ylabel('Orders')
plt.show()

ピークは、AM:11とPM:7ぐらいですね。したがって、最もオーダー数(客数)が多いこの時間帯に広告をディスプレイするのが良さそうです。
ワーク4: どの商品が最も一緒にセットで買われているでしょうか?
all_data.head()
| Order ID | Product | Quantity Ordered | Price Each | Order Date | Purchase Address | Month | Sales | City | State | Hour | Minute | |
|---|---|---|---|---|---|---|---|---|---|---|---|---|
| 0 | 176558 | USB-C Charging Cable | 2 | 11.95 | 2019-04-19 08:46:00 | 917 1st St, Dallas, TX 75001 | 4 | 23.90 | Dallas (TX) | TX 75001 | 8 | 46 |
| 2 | 176559 | Bose SoundSport Headphones | 1 | 99.99 | 2019-04-07 22:30:00 | 682 Chestnut St, Boston, MA 02215 | 4 | 99.99 | Boston (MA) | MA 02215 | 22 | 30 |
| 3 | 176560 | Google Phone | 1 | 600.00 | 2019-04-12 14:38:00 | 669 Spruce St, Los Angeles, CA 90001 | 4 | 600.00 | Los Angeles (CA) | CA 90001 | 14 | 38 |
| 4 | 176560 | Wired Headphones | 1 | 11.99 | 2019-04-12 14:38:00 | 669 Spruce St, Los Angeles, CA 90001 | 4 | 11.99 | Los Angeles (CA) | CA 90001 | 14 | 38 |
| 5 | 176561 | Wired Headphones | 1 | 11.99 | 2019-04-30 09:27:00 | 333 8th St, Los Angeles, CA 90001 | 4 | 11.99 | Los Angeles (CA) | CA 90001 | 9 | 27 |
OrderIDが一緒のものでグループ分けすればわかりそうですね
かぶっている値は、duplicated関数を使うと楽にソート出来ます。
df = all_data[all_data['Order ID'].duplicated(keep=False)]
df.head(20)
| Order ID | Product | Quantity Ordered | Price Each | Order Date | Purchase Address | Month | Sales | City | State | Hour | Minute | |
|---|---|---|---|---|---|---|---|---|---|---|---|---|
| 3 | 176560 | Google Phone | 1 | 600.00 | 2019-04-12 14:38:00 | 669 Spruce St, Los Angeles, CA 90001 | 4 | 600.00 | Los Angeles (CA) | CA 90001 | 14 | 38 |
| 4 | 176560 | Wired Headphones | 1 | 11.99 | 2019-04-12 14:38:00 | 669 Spruce St, Los Angeles, CA 90001 | 4 | 11.99 | Los Angeles (CA) | CA 90001 | 14 | 38 |
| 18 | 176574 | Google Phone | 1 | 600.00 | 2019-04-03 19:42:00 | 20 Hill St, Los Angeles, CA 90001 | 4 | 600.00 | Los Angeles (CA) | CA 90001 | 19 | 42 |
| 19 | 176574 | USB-C Charging Cable | 1 | 11.95 | 2019-04-03 19:42:00 | 20 Hill St, Los Angeles, CA 90001 | 4 | 11.95 | Los Angeles (CA) | CA 90001 | 19 | 42 |
| 30 | 176585 | Bose SoundSport Headphones | 1 | 99.99 | 2019-04-07 11:31:00 | 823 Highland St, Boston, MA 02215 | 4 | 99.99 | Boston (MA) | MA 02215 | 11 | 31 |
| 31 | 176585 | Bose SoundSport Headphones | 1 | 99.99 | 2019-04-07 11:31:00 | 823 Highland St, Boston, MA 02215 | 4 | 99.99 | Boston (MA) | MA 02215 | 11 | 31 |
| 32 | 176586 | AAA Batteries (4-pack) | 2 | 2.99 | 2019-04-10 17:00:00 | 365 Center St, San Francisco, CA 94016 | 4 | 5.98 | San Francisco (CA) | CA 94016 | 17 | 0 |
| 33 | 176586 | Google Phone | 1 | 600.00 | 2019-04-10 17:00:00 | 365 Center St, San Francisco, CA 94016 | 4 | 600.00 | San Francisco (CA) | CA 94016 | 17 | 0 |
| 119 | 176672 | Lightning Charging Cable | 1 | 14.95 | 2019-04-12 11:07:00 | 778 Maple St, New York City, NY 10001 | 4 | 14.95 | New York City (NY) | NY 10001 | 11 | 7 |
| 120 | 176672 | USB-C Charging Cable | 1 | 11.95 | 2019-04-12 11:07:00 | 778 Maple St, New York City, NY 10001 | 4 | 11.95 | New York City (NY) | NY 10001 | 11 | 7 |
| 129 | 176681 | Apple Airpods Headphones | 1 | 150.00 | 2019-04-20 10:39:00 | 331 Cherry St, Seattle, WA 98101 | 4 | 150.00 | Seattle (WA) | WA 98101 | 10 | 39 |
| 130 | 176681 | ThinkPad Laptop | 1 | 999.99 | 2019-04-20 10:39:00 | 331 Cherry St, Seattle, WA 98101 | 4 | 999.99 | Seattle (WA) | WA 98101 | 10 | 39 |
| 138 | 176689 | Bose SoundSport Headphones | 1 | 99.99 | 2019-04-24 17:15:00 | 659 Lincoln St, New York City, NY 10001 | 4 | 99.99 | New York City (NY) | NY 10001 | 17 | 15 |
| 139 | 176689 | AAA Batteries (4-pack) | 2 | 2.99 | 2019-04-24 17:15:00 | 659 Lincoln St, New York City, NY 10001 | 4 | 5.98 | New York City (NY) | NY 10001 | 17 | 15 |
| 189 | 176739 | 34in Ultrawide Monitor | 1 | 379.99 | 2019-04-05 17:38:00 | 730 6th St, Austin, TX 73301 | 4 | 379.99 | Austin (TX) | TX 73301 | 17 | 38 |
| 190 | 176739 | Google Phone | 1 | 600.00 | 2019-04-05 17:38:00 | 730 6th St, Austin, TX 73301 | 4 | 600.00 | Austin (TX) | TX 73301 | 17 | 38 |
| 225 | 176774 | Lightning Charging Cable | 1 | 14.95 | 2019-04-25 15:06:00 | 372 Church St, Los Angeles, CA 90001 | 4 | 14.95 | Los Angeles (CA) | CA 90001 | 15 | 6 |
| 226 | 176774 | USB-C Charging Cable | 1 | 11.95 | 2019-04-25 15:06:00 | 372 Church St, Los Angeles, CA 90001 | 4 | 11.95 | Los Angeles (CA) | CA 90001 | 15 | 6 |
| 233 | 176781 | iPhone | 1 | 700.00 | 2019-04-03 07:37:00 | 976 Hickory St, Dallas, TX 75001 | 4 | 700.00 | Dallas (TX) | TX 75001 | 7 | 37 |
| 234 | 176781 | Lightning Charging Cable | 1 | 14.95 | 2019-04-03 07:37:00 | 976 Hickory St, Dallas, TX 75001 | 4 | 14.95 | Dallas (TX) | TX 75001 | 7 | 37 |
同じIDのものが連続で並ぶデータになりました
上のデータセットは、IDがかぶっているオーダー(≒セット買いしたオーダー以外なし)です
IDでグループ分けしたうえで、そのIDで購入したオーダーが格納された列を作ります。(例 ID:1111 → 注文: Apple,Banana,Orange)
df = all_data[all_data['Order ID'].duplicated(keep=False)]
df['Grouped'] = df.groupby('Order ID')['Product'].transform(lambda x: ','.join(x))
# transformはapply関数のようなものです。一旦ここでは説明省略します。
df = df[['Order ID','Grouped']].drop_duplicates()
df.head(10)
/opt/anaconda3/lib/python3.7/site-packages/ipykernel_launcher.py:2: SettingWithCopyWarning:
A value is trying to be set on a copy of a slice from a DataFrame.
Try using .loc[row_indexer,col_indexer] = value instead

See the caveats in the documentation: http://pandas.pydata.org/pandas-docs/stable/user_guide/indexing.html#returning-a-view-versus-a-copy
| Order ID | Grouped | |
|---|---|---|
| 3 | 176560 | Google Phone,Wired Headphones |
| 18 | 176574 | Google Phone,USB-C Charging Cable |
| 30 | 176585 | Bose SoundSport Headphones,Bose SoundSport Hea... |
| 32 | 176586 | AAA Batteries (4-pack),Google Phone |
| 119 | 176672 | Lightning Charging Cable,USB-C Charging Cable |
| 129 | 176681 | Apple Airpods Headphones,ThinkPad Laptop |
| 138 | 176689 | Bose SoundSport Headphones,AAA Batteries (4-pack) |
| 189 | 176739 | 34in Ultrawide Monitor,Google Phone |
| 225 | 176774 | Lightning Charging Cable,USB-C Charging Cable |
| 233 | 176781 | iPhone,Lightning Charging Cable |
良い感じです。データがうまい具合にまとまってます。
このGrouped列で"どれが、どれと、どんな組み合わせで、何回ずつ"などを調べなければいけません
便利なライブラリを使いながら集計しましょう。ライブラリの具体的なイメージは以下のstackoverflowをご覧ください。
※inputとoutputのコードを眺めてだいたいこういうことか程度でOKです
https://stackoverflow.com/questions/56187042/python-itertools-make-combinations-with-sum/56187946#56187946
from itertools import combinations
from collections import Counter

count = Counter()
for row in df['Grouped']:
    row_list = row.split(',')
    count.update(Counter(combinations(row_list,2)))

count.most_common(10)
[(('iPhone', 'Lightning Charging Cable'), 1005),
 (('Google Phone', 'USB-C Charging Cable'), 987),
 (('iPhone', 'Wired Headphones'), 447),
 (('Google Phone', 'Wired Headphones'), 414),
 (('Vareebadd Phone', 'USB-C Charging Cable'), 361),
 (('iPhone', 'Apple Airpods Headphones'), 360),
 (('Google Phone', 'Bose SoundSport Headphones'), 220),
 (('USB-C Charging Cable', 'Wired Headphones'), 160),
 (('Vareebadd Phone', 'Wired Headphones'), 143),
 (('Lightning Charging Cable', 'Wired Headphones'), 92)]
ちょっと出力が汚いので、微修正します
for key,value in count.most_common(10):
    print(key,value)
('iPhone', 'Lightning Charging Cable') 1005
('Google Phone', 'USB-C Charging Cable') 987
('iPhone', 'Wired Headphones') 447
('Google Phone', 'Wired Headphones') 414
('Vareebadd Phone', 'USB-C Charging Cable') 361
('iPhone', 'Apple Airpods Headphones') 360
('Google Phone', 'Bose SoundSport Headphones') 220
('USB-C Charging Cable', 'Wired Headphones') 160
('Vareebadd Phone', 'Wired Headphones') 143
('Lightning Charging Cable', 'Wired Headphones') 92
iPhoneとチャージケーブルが一番多いですね
ワーク5(Final Work):どの商品が一番売れているでしょうか。なぜそれが一番売れていると思いますか?
最後のワークです。自分で考える(仮説の部分)が入ってきましたね。
データを可視化しましょう。
数量ベースで考えます
product_group = all_data.groupby('Product')
quantity_ordered = product_group.sum()['Quantity Ordered']
products = [product for product,df in product_group]
plt.bar(products,quantity_ordered)
plt.xlabel('Product')
plt.ylabel('Quantity Ordered')
plt.xticks(products,rotation="vertical",size=8)
plt.show()
バッテリー・ケーブルとかが多いですかね。
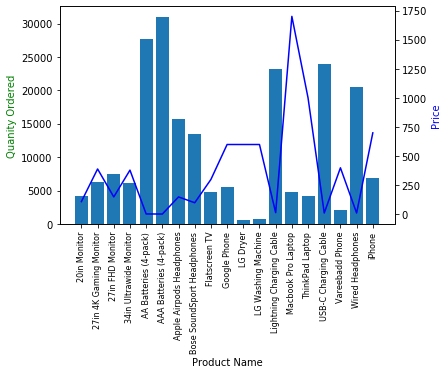
仮に値段が安いからと推測します。値段と売り上げを調べます。
prices = all_data.groupby('Product').mean()['Price Each']

fig, ax1 = plt.subplots()

ax2 = ax1.twinx()
# x軸共通でy軸の値が異なるグラフ生成
ax1.bar(products,quantity_ordered)
ax2.plot(products,prices,'b-')

ax1.set_xlabel('Product Name')
ax1.set_ylabel('Quanity Ordered', color="g")
ax2.set_ylabel('Price', color="b")
ax1.set_xticklabels(products,rotation="vertical",size=8)

plt.show()
以上で終了です。