English below
↓↓↓↓↓↓↓↓
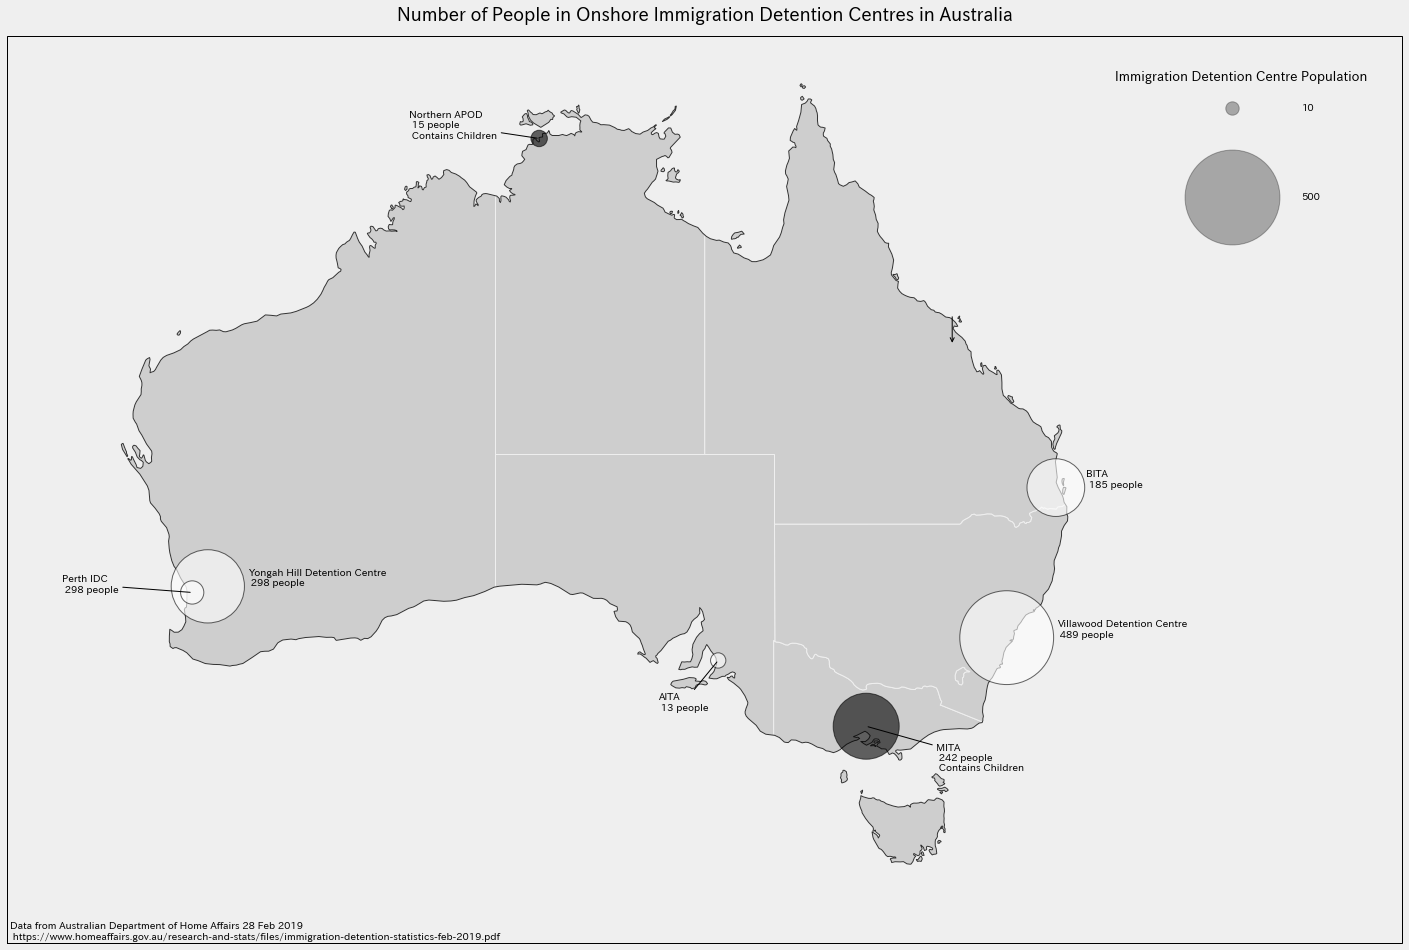
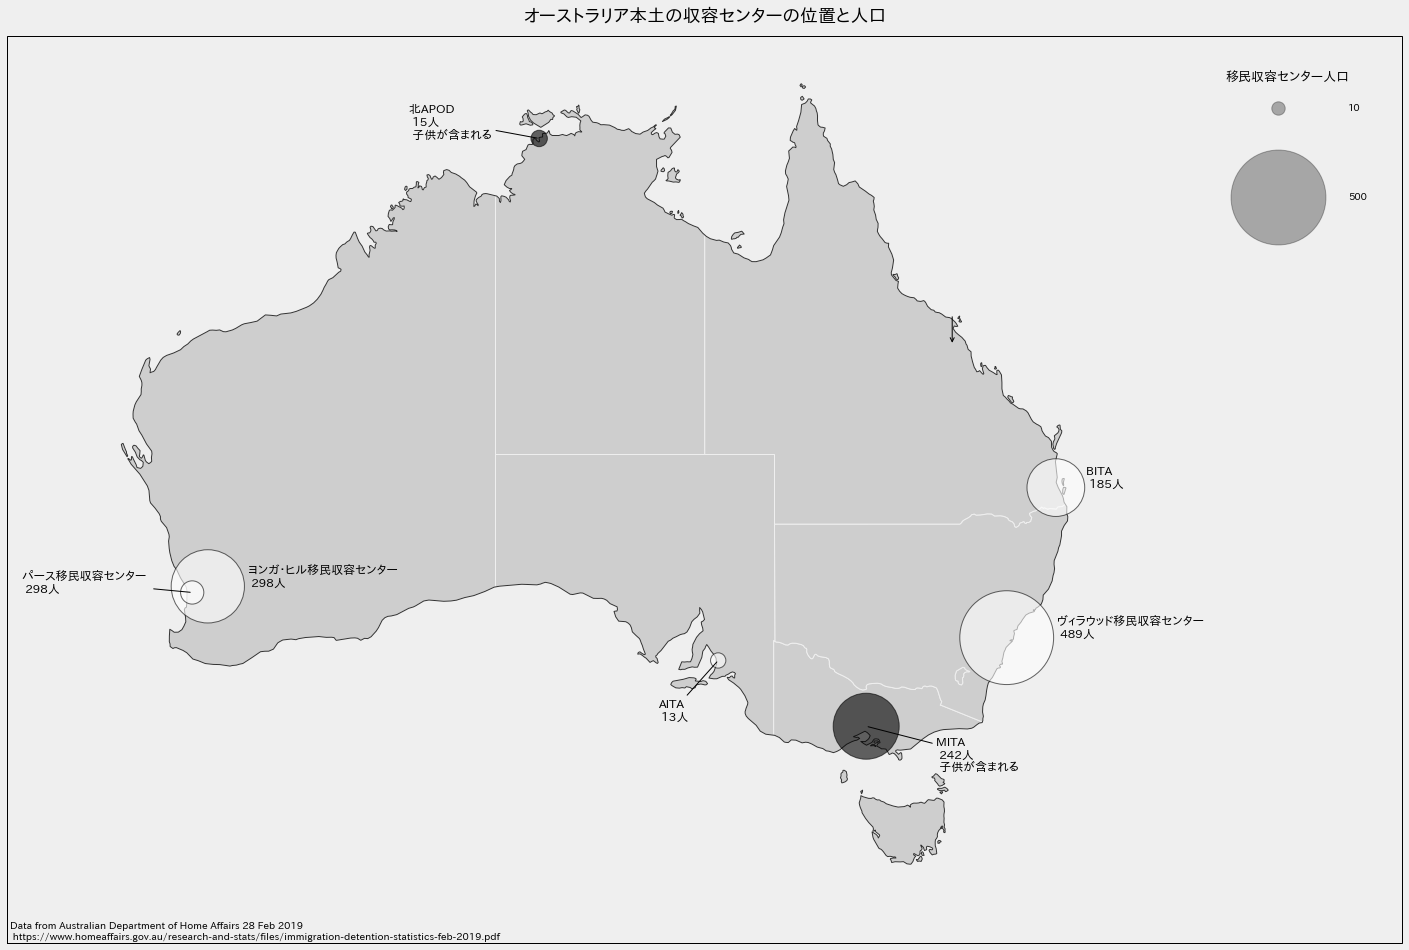
下は2019年02月19日のオーストラリア本土の移民収容センター人口の地図。沖合いにある移民収容センターが含まれません。この地図はPythonのGeopandas、Cartopy、Matplotlib、とJupyter Labで全部作られました。僕はこれをMonochrome Mapping Competitionに提出しました。Jupyterファイルがこのリンクである:
日本語上記
↑↑↑↑↑↑
This is a map showing every onshore immigration detention center in Australia and their population as of February 28th 2019. This does not include offshore immigration detention centers. This map was done completely in Python, using Geopandas, Cartopy, Matplotlib, and Jupyter Lab. I originally made it in color, and then made the black and white version for the Monochrome Mapping Competition, which I ended up liking better. The jupyter notebook files for this project can be found here