はじめに
この記事は,STLファイルを例にしてPythonでバイナリファイルを読み込む方法を調べたときのメモです.
Google Colab と Gist にコードがあります.
単にPythonでSTLファイルを読み込みたいのであればnumpy-stlなどを利用したほうが良いです.
ASCII形式とバイナリ形式
STLファイルにはASCII形式とバイナリ形式の2種類が存在します.下のサイトでフォーマットが詳しく説明されています.
ASCII形式は人間が読みやすい形式で,メモ帳で開いて頂点の座標などを確認することができます.反対にバイナリ形式はメモ帳で開いても何もわかりませんが,その分ASCIIと比べてファイルサイズが小さいというメリットがあります.
この記事ではバイナリ形式のSTLファイルをPythonで読み込み表示させます.
読み込み
↑のサイトによると,バイナリSTLファイルのフォーマットは次のようになっています.()内はバイト数です.
- ヘッダー(80)
- 三角形の数 unsigned int(4)
- 各三角形ごとに
- 法線ベクトル(4×3)
- x成分 float(4)
- y成分 float(4)
- z成分 float(4)
- 頂点1の座標(4×3)
- x成分 float(4)
- y成分 float(4)
- z成分 float(4)
- 頂点2の座標(4×3)
- ...
- 頂点3の座標(4×3)
- ...
- 未使用データ(2)
- 法線ベクトル(4×3)
Pythonで実装します.
import struct
import numpy as np
def load_stl(filename):
    with open(filename, "rb") as f:
        header = f.read(80)                             # header
        n_triangles = struct.unpack("I", f.read(4))[0]  # 三角形の数.unpackはtupleを返すので0番目を取り出す.
        print(f"header: {header}")
        print(f"三角形の数: {n_triangles}")

        vertices = []
        for i in range(n_triangles):                    # 各三角形ごとに
            norm = struct.unpack("3f", f.read(4*3))     # 法線ベクトル
            vert1 = struct.unpack("3f", f.read(4*3))    # 頂点1
            vert2 = struct.unpack("3f", f.read(4*3))    # 頂点2
            vert3 = struct.unpack("3f", f.read(4*3))    # 頂点3
            _ = f.read(2)                               # 未使用データ

            vert = np.asarray([vert1, vert2, vert3])    # 3つの頂点をまとめる
            vertices.append(vert)
        vertices = np.stack(vertices)

        # verticesは (三角形の数, 頂点の数 3, 頂点の座標 3) の形
        return vertices
unpackに指定するフォーマット("3f","I"など)は,structのドキュメントにある表とSTLファイルのフォーマットを見比べて決めます.
フォーマットの先頭に付いている数字で連続する同じデータ型をまとめて指定しています.例えば"3f"はfloatが3つ連続していることを表しています.4バイトのfloatが3つで合計12バイトなので,f.read(4*3)で12バイト読み込んでいます.

今回法線ベクトルは使わないので,load_stl()では捨てています.
matplotlibで表示
load_stl()で抽出した頂点の座標をplot_stl()で表示します.
import matplotlib.pyplot as plt
from mpl_toolkits import mplot3d

def plot_stl(vectors):
    figure = plt.figure()
    axes = mplot3d.Axes3D(figure)

    collection = mplot3d.art3d.Poly3DCollection(vectors)
    collection.set_linewidth(0.5)
    collection.set_facecolor("w")
    collection.set_edgecolor("black")
    collection.set_alpha(0.5)

    axes.add_collection3d(collection)

    scale = vectors.flatten()
    axes.auto_scale_xyz(scale, scale, scale)
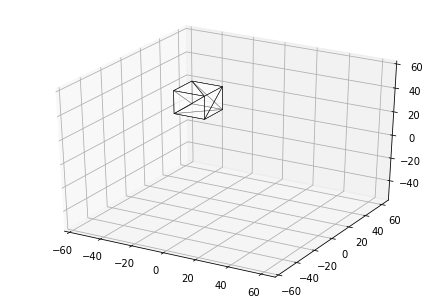
実際にSTLを読み込んで表示します.
vectors = load_stl("/content/Cube_3d_printing_sample.stl")
plot_stl(vectors)
output:
header: b'binary stl file                                                                \x00'
三角形の数: 12
おわりに
当然ですがこのコードでASCII形式のSTLファイルを読み込もうとするとエラーが出ます.numpy-stlなどの多くのツールはどちらの形式でも処理してくれるものが多いです.