記事の内容
先日Twitterのフォロー相関図を作成する記事を書きました。
[Python]Twitterのフォロー関係を可視化してみた
上記の記事ではTwitterAPIでフォローアカウントの情報を取得しmongoDBに登録する。
その後、mongoDBからデータを取得し、相互フォローしているかを確認しながらグラフに描画するというロジックでした。
GraphDBというものを使えばネットワーク分析などに便利だということを知ったので、この仕組みをGraphDBでもやってました。
環境
python:3.7
gremlinpython:3.4.6
gremlin:3.4.6
Gremlinのインストール
私はWindowsで環境を構築しました。
Windows用のツールは以下からダウンロードできます。
https://downloads.apache.org/tinkerpop/3.4.6/
ダウンロードするのは「server」です。「console」はあると便利ですが、今回の記事では使いません。
ダウンロード後はZIPを解凍し、任意のフォルダに配置し、binフォルダ配下のbatを実行するだけです。
gremlinpython
pipコマンドでインストールできます。
pip install gremlinpython
実装
環境が出来たので実装していきます
mongoDBのデータをGremlinに登録する
GremlinはGraph型のデータモデルを扱えるDBです。
mongoDBではデータ間のリレーションは管理出来ませんでしたので、Gremlinにデータを登録しながらデータのリレーションを登録していきます。
mongoDBのデータ
mongoDBのデータは以下のとおりです。
Twitterのアカウントと、そのアカウントがフォローしているアカウントのリストが登録されています。
以下のようなデータが多数登録されています。
{
        "_id" : ObjectId("5e6c52a475646eb49cfbd62b"),
        "screen_name" : "yurinaNECOPLA",
        "followers_info" : [
                {
                        "screen_name" : "Task_fuuka",
                        "id" : NumberLong("784604847710605312")
                },
      (略)
                {
                        "screen_name" : "nemui_oyasumi_y",
                        "id" : NumberLong("811491671560974336")
                }
        ]
}
コード
from gremlin_python import statics
from gremlin_python.structure.graph import Graph
from gremlin_python.process.graph_traversal import __
from gremlin_python.process.traversal import TraversalSideEffects
from gremlin_python.driver.driver_remote_connection import DriverRemoteConnection
from mongo_dao import MongoDAO

mongo = MongoDAO("db", "followers_info")
graph = Graph()

# Gremlinのコネクション作成
g = graph.traversal().withRemote(DriverRemoteConnection('ws://localhost:8182/gremlin','g'))

start_name = 'yurinaNECOPLA'

def addValueEdge(parent_name, depth):
    if depth == 0:
        return False
    print(parent_name)
    result = mongo.find_one(filter={'screen_name': parent_name})
    if result == None or len(result) == 0:
        return False

    # 頂点の追加
    g.addV(parent_name).property('screen_name', parent_name).toSet()
    p = g.V().has('screen_name', parent_name).toList()[0]

    for follower in result['followers_info']:
        if addValueEdge(follower['screen_name'], depth-1):
            cList = g.V().has('screen_name', follower['screen_name']).toList()
            if len(cList) != 0:
                # エッジの追加
                g.addE('follow').from_(p).to(cList[0]).toSet()
    return True

addValueEdge(start_name, 3)
コード解説
- 頂点となるアカウントを決める
- addValueEdgeにアカウント名を渡す
- MongoDBからデータを取得
- データが取得出来たらGremlinに頂点を追加する
- フォローしているアカウント名を1件ずつ渡す(2. に戻る)
- エッジを追加する
この様に再帰的にデータとエッジを登録していきます。
相関図を作成する
基本的な作りはmongoDBからデータ取得した時と同じです。
import json
import networkx as nx
import matplotlib.pyplot as plt
from gremlin_python import statics
from gremlin_python.structure.graph import Graph
from gremlin_python.process.graph_traversal import __
from gremlin_python.process.traversal import TraversalSideEffects
from gremlin_python.driver.driver_remote_connection import DriverRemoteConnection

start_screen_name = 'yurinaNECOPLA'
graph = Graph()

# Gremlinのコネクション作成
g = graph.traversal().withRemote(DriverRemoteConnection('ws://localhost:8182/gremlin','g'))

# 新規グラフを作成
G = nx.Graph()
 #ノードを追加
G.add_node(start_screen_name)

def add_edge(screen_name, depth):
    if depth == 0:
        return
    name = g.V().has('screen_name', screen_name).toList()[0]
    follows_list = g.V(name).both().valueMap().toList()
    for follow in follows_list:
        print(follow['screen_name'][0])
        G.add_edge(screen_name, follow['screen_name'][0])
        add_edge(follow['screen_name'][0], depth-1)

add_edge(start_screen_name, 3)

# 図の作成。figsizeは図の大きさ
plt.figure(figsize=(10, 8))

# 図のレイアウトを決める。kの値が小さい程図が密集する
pos = nx.spring_layout(G, k=0.8)

# ノードとエッジの描画
# _color: 色の指定
# alpha: 透明度の指定
nx.draw_networkx_edges(G, pos, edge_color='y')
nx.draw_networkx_nodes(G, pos, node_color='r', alpha=0.5)

# ノード名を付加
nx.draw_networkx_labels(G, pos, font_size=10)

# X軸Y軸を表示しない設定
plt.axis('off')

plt.savefig("mutual_follow.png")
# 図を描画
plt.show()
コード解説
ポイントとなる部分は以下になります。
    name = g.V().has('screen_name', screen_name).toList()[0]
    follows_list = g.V(name).both().valueMap().toList()
    for follow in follows_list:
        print(follow['screen_name'][0])
        G.add_edge(screen_name, follow['screen_name'][0])
        add_edge(follow['screen_name'][0], depth-1)
1行目でフォロワーの情報をGremlinから取得します。
2行目で取得した情報のエッジの情報を取得できます。
このデータはdict型のlistになっていますので、1件ずつ取得しscreen_nameを取得すればアカウント名を得ることが出来ます。
結果
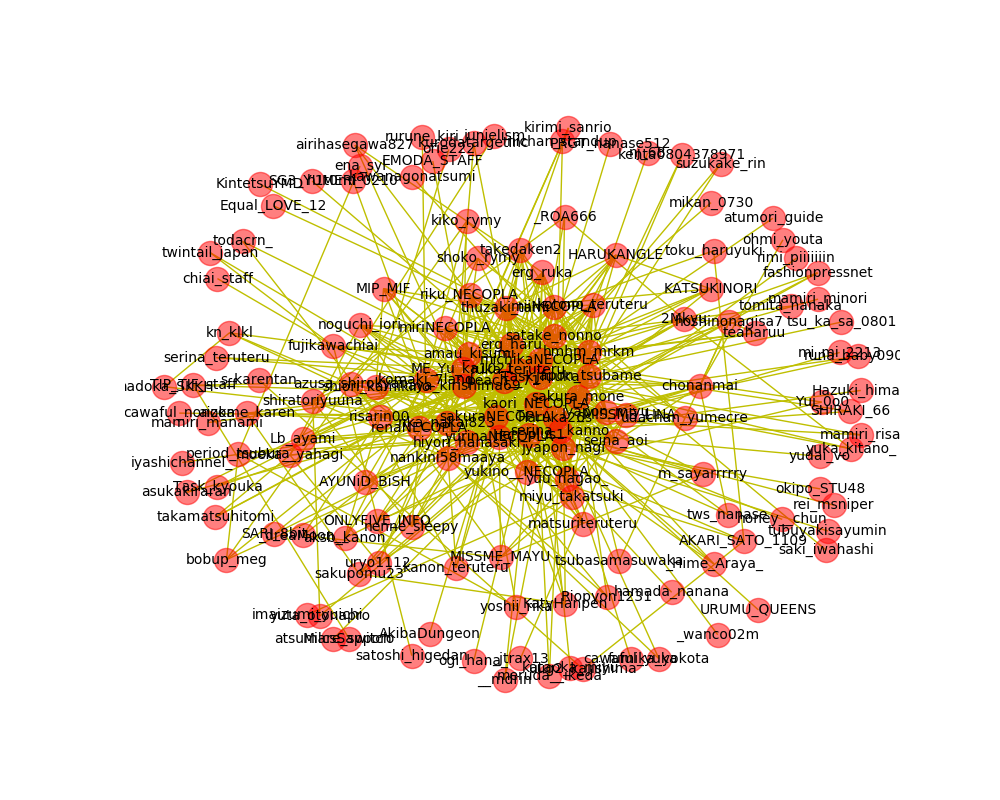
かなり見辛い結果になりましたが、相関図を作成することが出来ました。
別パターンの相関図
上記の相関図はアカウントA→アカウントB、アカウントB→アカウントC、アカウントC→アカウントAといった循環した関係も表現されています。
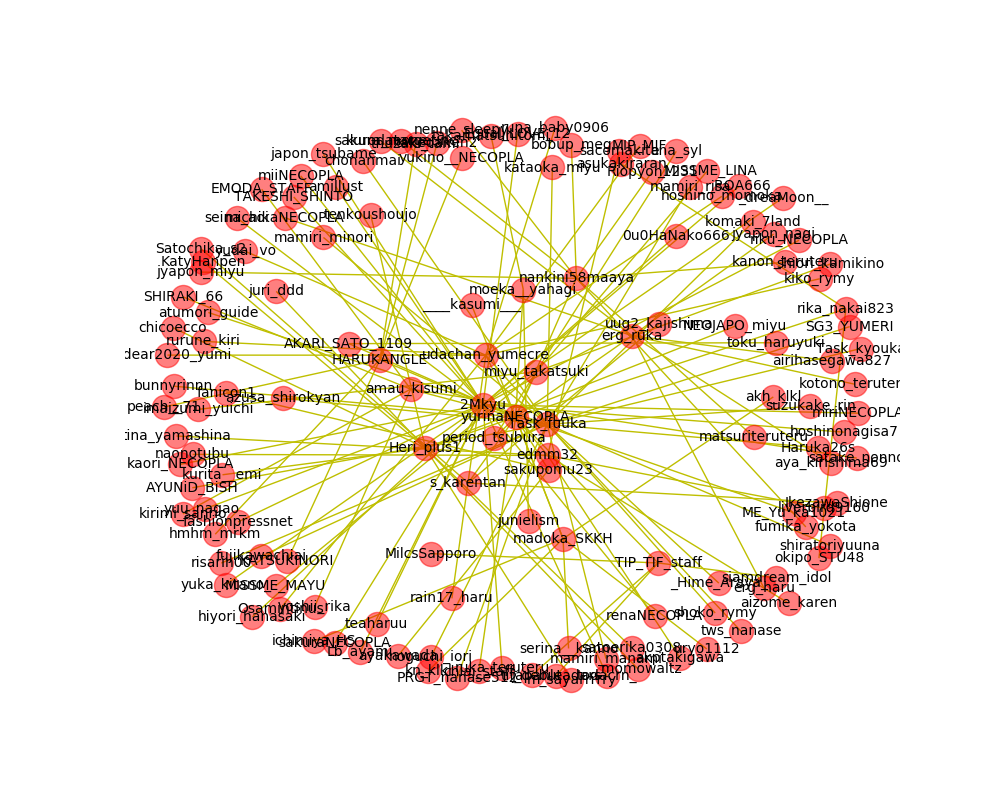
循環しないようにするのであれば、Gremlinに登録するタイミングで既に登録されているデータは追加対象外という制御を加えることで実現出来ます。
def registCheck(screen_name):
    check = g.V().has('screen_name', screen_name).toList()
    if len(check) == 0:
        return False
    else:
        return True

def addValueEdge(parent_name, depth):
    if depth == 0 or registCheck(parent_name):
        return False
    print(parent_name)
    result = mongo.find_one(filter={'screen_name': parent_name})
    if result == None or len(result) == 0:
        return False

    # 頂点の追加
    g.addV(parent_name).property('screen_name', parent_name).toSet()
    p = g.V().has('screen_name', parent_name).toList()[0]

    for follower in result['followers_info']:
        if addValueEdge(follower['screen_name'], depth-1):
            cList = g.V().has('screen_name', follower['screen_name']).toList()
            if len(cList) != 0:
                # エッジの追加
                g.addE('follow').from_(p).to(cList[0]).toSet()
    return True
Gremlinにデータが登録されているか確認するためのregistCheckを追加することで循環する関係は除外出来ました。
結果
まとめ
循環ありの図では相互フォローしあっている関係の深いアカウント同士が纏まって出力されています。
循環なしの図では起点としたアカウントがフォローしているアカウントが近くに出力されていますが、再帰的にロジックを組んでいるため、アカウントAと相互フォローしているアカウントが離れた位置に出力されているものもあります。
エッジの設定方法はまだまだ検討していく必要がありそうです。
データの関係を登録するというのはRDBに近いものがありますが、gremlinpythonで扱うには直感的に扱うことは非常に難しい印象を受けました。
ある程度、ドキュメントを読んで仕組みなどを理解することが出来ればネットワーク分析などに活かすことが出来そうです。

