はじめに
グラフを描いたりできる。
サイトはこちら
http://nvd3.org/index.html
使うよ
コードはこんなの
index.html
<!DOCTYPE html>
<meta charset="utf-8">
<link href="https://cdn.rawgit.com/novus/nvd3/v1.8.1/build/nv.d3.css" rel="stylesheet" type="text/css">
<body>
<div id="chart">
<svg style="height:500px;" />
</div>
<script src="https://d3js.org/d3.v3.min.js"></script>
<script src="https://cdn.rawgit.com/novus/nvd3/v1.8.1/build/nv.d3.js"></script>
<script type="text/javascript">
nv.addGraph(function() {
//var chart = nv.models.historicalBarChart();
//var chart = nv.models.lineWithFocusChart();
var chart = nv.models.lineChart();
chart.xAxis.tickFormat(d3.format(',f'));
chart.yAxis.tickFormat(d3.format(',.2f'));
d3.select('#chart svg')
.datum(testData())
.transition().duration(500)
.call(chart);
nv.utils.windowResize(chart.update);
return chart;
});
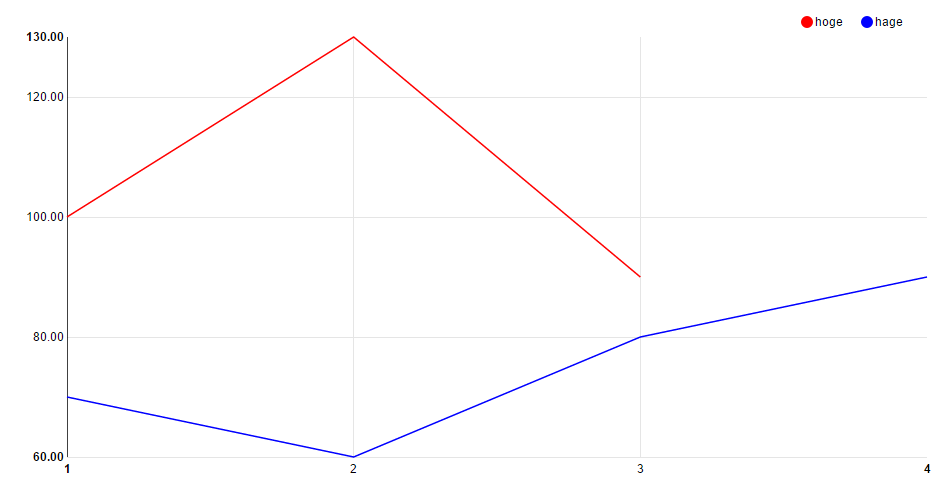
function testData() {
return [{color:'red',
key:'hoge',
values: [{x:1,y:100},
{x:2,y:130},
{x:3,y:90},]},
{color:'blue',
key:'hage',
values: [{x:1,y:70},
{x:2,y:60},
{x:3,y:80},
{x:4,y:90}]}];
}
</script>
</body>
グラフ
こんなのが出る