1. 概要
* その1( https://qiita.com/asys/items/d28a0ce0a8f51681a243 )に引き続き『経済・ファイナンスデータの計量時系列分析』を元に勉強中。
* 今回は2章に当たる部分、ARMAモデルについて。
2. データ
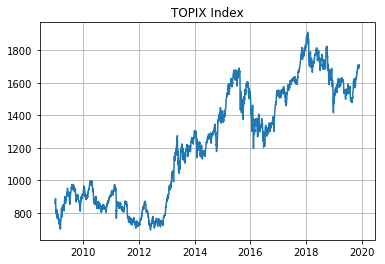
前回に引き続きTOPIXのヒストリカルデータを使用する。
加えて、自己相関がありそうなデータがあるといい気がしたので、月次訪日外客数のデータを用意した。下記リンクのJTB総合研究所のHPのものを使用させていただいた。
https://www.tourism.jp/tourism-database/stats/inbound/
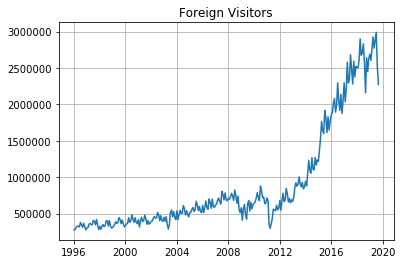
まあぱっと見たところ季節性があって、アベノミクスでの円安もあって全体として上昇トレンドという感じのデータです。
3. Moving Average Process
MA過程について、まずは1次MA過程から見ていく。
$MA(1):y_t=\mu+\epsilon_t+\theta_1\epsilon_{t-1}, \quad \epsilon_t \sim W.N.(\sigma^2)$
いくつかパラメータを決めてプロットしてみる。
とりあえず$\sigma=1.0$として、numpyのrandom.randnを使う。
wn = np.random.randn(50)
mu = 0.0
theta_1 = 1.0
map = mu + wn[1:] + theta_1 * wn[:-1]
という具合にデータを生成した。

緑の線の$\theta_1=0.0$を基準に考えると、$\theta_1$の符号や値の大小の影響が分かりやすい。青線($\theta_1=1.0$)と赤線($\theta_1=-1.0$)は緑線を挟んでちょうど等距離の反対側に位置し、オレンジ線($\theta_1=0.5$)は青線と緑線の中間を推移している。
主な統計量は以下の通り。
mean : $\quad E(y_t)=\mu$
variance : $\quad \gamma_0=Var(y_t)=(1+\theta_1^2)\sigma^2$
first-order auto-covariance : $\quad \gamma_1=Cov(y_t,y_{t-1}) = \theta_1\sigma^2$
first-order auto-correlation : $\quad \rho_1=\frac{\gamma_1}{\gamma_0}=\frac{\theta_1}{1+\theta_1^2}$
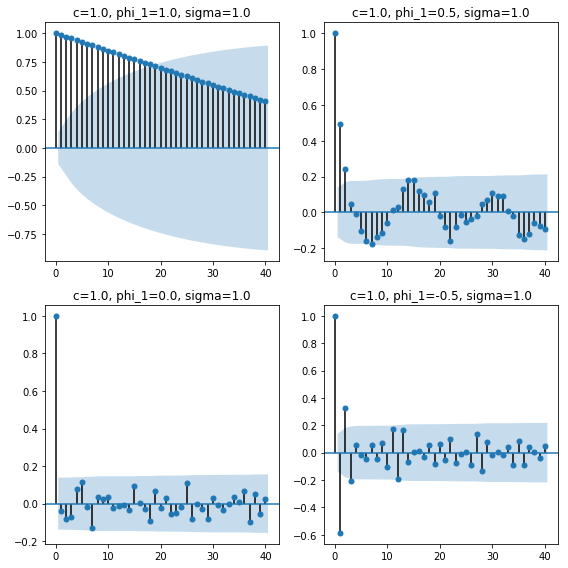
コレログラムを確認する。上のプロットではデータ数50としたが、ここではデータ数1,000で作成している。
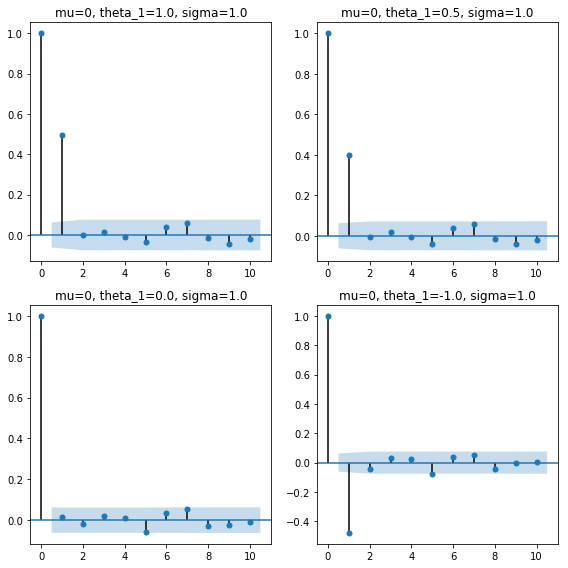
ここまでは直感的なイメージ通り。1次の自己相関のみ有意で、$\theta_1<0$では自己相関はマイナスの値となる。
次にMA過程を一般化したものを見ていく。
$MA(q):y_t=\mu+\epsilon_t+\theta_1\epsilon_{t-1}+\theta_2\epsilon_{t-2}+\cdots+\theta_q\epsilon_{t-q}, \quad \epsilon_t \sim W.N.(\sigma^2)$
主な統計量は以下の通り。
$\quad E(y_t)=\mu$
$\quad \gamma_0=Var(y_t)=(1+\theta_1^2+\theta_2^2+\cdots+\theta_q^2)\sigma^2$
$\quad\gamma_k=\left\{\begin{array}{ll}(\theta_k+\theta_1\theta_{k+1}+\cdots+\theta_{q-k}\theta_q)\sigma^2,& 1\leqq k\leqq q\\0, & k\geqq q+1\end{array}\right.$
$\quad$MA過程は常に定常である
$\quad\rho_k=\left\{\begin{array}{ll}\frac{\theta_k+\theta_1\theta{k+1}+\cdots+\theta_{q-k}\theta_q}{1+\theta_1^2+\theta_2^2+\cdots+\theta_q^2},&1\leqq k\leqq q\\0,&k\geqq q+1\end{array}\right.$
【補足】定常性(stationarity)とは
$\quad$以下が成立する場合、過程は弱定常性(weak stationarity)である。
$\qquad \forall t,k\in\mathbb{N},\quad E(y_t)=\mu \land Cov(y_t,t_{t-k})=E[(y_t-\mu)(y_{t-k}-\mu)]=\gamma_k$
$\quad$また、このとき、自己相関
$\qquad Corr(y_t,y_{t-k})=\frac{\gamma_kt}{\sqrt{\gamma_{0,t}\gamma_{0,t-k}}}=\frac{\gamma_k}{\gamma_0}=\rho_k$
$\quad$が成立する。
$\quad$自己共分散も自己相関も時間差$k$にのみ依存する。
$\quad$また、$\gamma_k=\gamma_{-k}$、$\rho_k=\rho_{-k}$が成立する。
4. Autoregressive Process
次にAR過程である。まずは1次AR過程から。
$AR(1):y_t=c+\phi_1y_{t-1}+\epsilon_t,\quad \epsilon_t\sim W.N.(\sigma^2)$
プロットしてみる。ここでは$y_0=0$と$c=1$、$\sigma^2=1$とした。
AR1 = []
y = 0
c = 1
phi_1 = 0.5
for i in range(200):
    AR1.append(y)
    y = c + phi_1*y + np.random.randn()
$\phi_1=1.0$の時、過程は定常でない様子が視覚的にもよく分かる。実際、$|\phi_1|\leq1$の時に過程は定常となる。
$\phi_1$の値については、小さくなるほど平均値が下がっている様子や、小さくなっているほど平均値を跨いで上下している様子が見て取れる。
主な統計量については以下の通り。ただし、$|\phi_1|\leq1$で$y$は定常とする。
$\quad E(y_t)=c+\phi_1E(y_{t-1})=\frac{c}{1-\phi_1}$
$\quad Var(y_t)=\phi_1^2Var(y_{t-1})+\sigma^2=\frac{\sigma^2}{1-\phi_1^2}$
$\quad \gamma_k=\phi_1\gamma_{k-1}$
$\quad \rho_k=\phi_1\rho_{k-1}\qquad\cdots $(Yule-Walker Equation)
次に一般化したAR過程である。
$AR(p):y_t=c+\phi_1y_{t-1}+\phi_2y_{t-2}+\cdots+\phi_py_{t-p}+\epsilon_t, \quad \epsilon_t\sim W.N.(\sigma^2)$
主な統計量は以下の通り。
$\quad \mu=E(y_t)=\frac{c}{1-\phi_1-\phi_2-\cdots-\phi_p}$
$\quad \gamma_0=Var(y_t)=\frac{\sigma^2}{1-\phi_1\rho_1-\phi_2\rho_2-\cdots-\phi_p\rho_{p}}$
$\quad \gamma_k=\phi_1\gamma_{k-1}+\phi_2\gamma_{k-2}+\cdots+\phi_p\gamma_{k-p},\quad k\geqq1$
$\quad \rho_k=\phi_1\rho_{k-1}+\phi_2\rho_{k-2}+\cdots+\phi_p\rho_{k-p},\quad k\geqq1,\quad\cdots$(Yule-Walker Equation)
$\quad$AR過程の自己相関は指数的に減衰する。
5. Autoregressive Moving Average Process
AR過程とMA過程を合わせたARMA過程の一般項は以下で与えられる。
$ARMA(p,q):y_t=c+\phi_1y_{t-1}+\cdots+\phi_py_{t-p}+\epsilon_t+\theta_1\epsilon_t-1+\cdots+\theta_q\epsilon_{t-q},\quad \epsilon_t\sim W.N.(\sigma^2)$
$ARMA(p,q)$は以下のような性質を持つ。
$\quad \mu=E(y_t)=\frac{c}{1-\phi_1-\phi_2-\cdots-\phi_q}$
$\quad \gamma_k=\phi_1\gamma_{k-1}+\phi_2\gamma_{k-2}+\cdots+\phi_p\gamma_{k-p},\quad k\geqq q+1$
$\quad \rho_k=\phi_1\rho_{k-1}+\phi_2\rho_{k-2}+\cdots+\phi_p\rho_{k-p},\quad k\geqq q+1$
$\quad$ARMA過程の自己相関は指数的に減衰する。
$ARMA(3,3)$を実際にプロットしてみる。パラメータは以下のようにした。
$c=1.5, \phi_1=-0.5, \phi_2=0.5,\phi_3=0.8, \theta_1=0.8, \theta_2=0.5, \theta_3=-0.5, \sigma=1$
arma = [0,0,0]
wn = [0,0,0]
c = 1.5
phi_1 = -0.5
phi_2 = 0.5
phi_3 = 0.8
theta_1 = 0.8
theta_2 = 0.5
theta_3 = -0.5
for i in range(1000):
    eps = np.random.randn()
    y = c + phi_1*arma[-1] + phi_2*arma[-2] + phi_3*arma[-3] + eps + theta_1*wn[-1] + theta_2*wn[-2] + theta_3*wn[-3]
    wn.append(eps)
    arma.append(y)
- ARMA過程の定常性と反転可能性
MA過程は定常であるが、AR過程は定常であるとは限らない。
同一の期待値と自己相関構造を持つMA過程が複数存在するため、モデル選択上問題となる。
これを考える上で重要なのが定常性と反転可能性である。
定常性
(これはAR過程の定常条件と同じである。)
AR characteristic equation : $1-\phi_1z-\cdots-\phi_pz^p=0$
このAR特性方程式の全ての解の絶対値が1より大きい時AR過程は定常となる。
反転可能性
MA過程がAR(∞)過程に書き直せる時MA過程は反転可能である。
MA characteristic equation : $1+\theta_1z+\theta_2z^2+\cdots+\theta_pz^p=0$
このMA特性方程式の全ての解が1より大きい時、MA過程は反転可能となる。
モデル選択上は反転可能なMA過程が望ましいとされている。
6. ARMAモデルの推定
-
最小2乗法(OLS : ordinary least squares)
OLSは実際に観測された値とARMAモデルによる推定値の残差平方和(SSR : sum of squared residuals)を最小になるようARMAモデルのパラメータを選択する。
$\quad\displaystyle{\min_{\Theta}}\quad SSR=(y_t-ARMA(\Theta))^2$
それぞれのパラメータに対してパラメータで偏微分した正規方程式を解いてやればいい。
$\quad \frac{\partial SSR}{\partial \Theta}=0$ -
最尤法(MLE : maximum likelihood estimation)
対数尤度が最大となるパラメータを選択するアプローチが最尤法である。
$\quad\displaystyle{\max_{\Theta}}\quad \mathcal{L}(\theta) = \displaystyle\sum_{t=1}^{T}\log f_{Y_t|Y_{t-1}}(y_t|y_{t-1};\Theta)$
ここからは実際に5.で作成した$ARMA(3,3)$についてパラメータの推定を行ってみる。
手で計算していくのは煩雑なのでstatsmodelsライブラリを使用する。
詳細は以下のURLに。
https://www.statsmodels.org/stable/generated/statsmodels.tsa.arima_model.ARMA.html
ARMAの引数に標本サンプルとorder=(p,q)でモデルの次数を与えてやると最尤推定でパラメータを算出してくれる、という感じである。
arma_model = sm.tsa.ARMA(arma, order=(3,3))
result = arma_model.fit()
print(result.summary())
                              ARMA Model Results
==============================================================================
Dep. Variable:                      y   No. Observations:                 1003
Model:                     ARMA(3, 3)   Log Likelihood               -1533.061
Method:                       css-mle   S.D. of innovations              1.113
Date:                Sun, 08 Dec 2019   AIC                           3082.123
Time:                        14:51:34   BIC                           3121.409
Sample:                             0   HQIC                          3097.052

==============================================================================
                 coef    std err          z      P>|z|      [0.025      0.975]
------------------------------------------------------------------------------
const          6.8732      0.410     16.773      0.000       6.070       7.676
ar.L1.y       -0.4986      0.024    -21.149      0.000      -0.545      -0.452
ar.L2.y        0.5301      0.019     27.733      0.000       0.493       0.568
ar.L3.y        0.8256      0.020     41.115      0.000       0.786       0.865
ma.L1.y        0.7096      0.036     19.967      0.000       0.640       0.779
ma.L2.y        0.3955      0.039     10.176      0.000       0.319       0.472
ma.L3.y       -0.4078      0.033    -12.267      0.000      -0.473      -0.343
                                    Roots
=============================================================================
                  Real          Imaginary           Modulus         Frequency
-----------------------------------------------------------------------------
AR.1            1.0450           -0.0000j            1.0450           -0.0000
AR.2           -0.8436           -0.6689j            1.0766           -0.3933
AR.3           -0.8436           +0.6689j            1.0766            0.3933
MA.1           -0.6338           -0.8332j            1.0469           -0.3535
MA.2           -0.6338           +0.8332j            1.0469            0.3535
MA.3            2.2373           -0.0000j            2.2373           -0.0000
-----------------------------------------------------------------------------
という具合である。
そこそこ元のパラメータに近い値を推定できている。
いくつか注記しておくと、S.D. of innovations がホワイトノイズの分散を表している他、constからcの値を求めるには、
print(result.params[0] * (1-result.arparams.sum()))
0.9824998883509097
としてやる必要がある。
7. ARMAモデルの選択
$ARMA(p,q)$の選択としてはまず自己相関と偏自己相関の値から、$p,q$の値を保守的に絞り込み、その後情報量基準により最適なモデルを決定するというアプローチを取る。
まず、k次偏自己相関(partial autocorrelation)とは、$y_t$と$y_{t-k}$から$y_{t-1},\cdots,y_{t-k+1}$の影響を取り除いたものの相関と定義される。
$\left\{\begin{array}{lll}MA(q):&y_t=\mu+\epsilon_t+\theta_1\epsilon_{t-1}+\theta_2\epsilon_{t-2}+\cdots+\theta_q\epsilon_{t-q}\\AR(p):&y_t=c+\phi_1y_{t-1}+\phi_2y_{t-2}+\cdots+\phi_py_{t-p}+\epsilon_t\\ARIMA(p,q):&y_t=c+\phi_1y_{t-1}+\cdots+\phi_py_{t-p}+\epsilon_t+\theta_1\epsilon_t-1+\cdots+\theta_q\epsilon_{t-q} \end{array}\right.$
上記定義を考えると以下のテーブルのような性質が明らかである。
| モデル | 自己相関 | 偏自己相関 |
|---|---|---|
| $AR(p)$ | 減衰していく | $p+1$次以降$0$ |
| $MA(q)$ | $q+1$次以降$0$ | 減衰していく |
| $ARMA(p,q)$ | 減衰していく | 減衰していく |
これにより標本自己相関と標本偏自己相関の構造を見ればある程度のモデルの絞り込みが可能になる。
次に情報量基準(IC : information criterion)である。
$\quad IC=-2\mathcal{L}(\hat{\Theta})+p(T)k$
$\quad$ where T : number of samples, k : number of parameters
よく用いられる情報量基準として以下の2つがある。
$\left\{\begin{array}{ll}赤池情報量基準(AIC):\quad&AIC=-2\mathcal(L)(\hat{\Theta})+2k\\Schwarz情報量基準(SIC):&SIC=-2\mathcal(L)(\hat{\Theta})+\log(T)k\end{array}\right.$
SICの方が小さなモデルを選ぶ傾向があるが、標本数が十分にあればAICの過大な部分のパラメータの最尤推定量が0に収束することもあり、どちらが優れた基準かを一概に言うことはできない。
8. 実際のデータのモデル化
TOPIXと訪日外客数のデータを用意したわけだが、どちらも定常とは言えないのではないかという形状をしている。
そこで仕方なく訪日外客数の1996年から2007年の部分について、移動平均を差し引いてトレンドを排除したデータを作ることにした。
visit.head(3)
| month | visits | |
|---|---|---|
| 0 | 1996-01-01 | 276086 |
| 1 | 1996-02-01 | 283667 |
| 2 | 1996-03-01 | 310702 |
visit['trend'] = visit['visits'].rolling(window=13).mean().shift(-6)
visit['residual'] = visit['visits'] - visit['trend']
v = visit[visit['month']<'2008-01-01']
plt.plot(v['month'].values, v['visits'].values, label='original')
plt.plot(v['month'].values, v['trend'].values, label='trend')
plt.plot(v['month'].values, v['residual'].values, label='residual')
plt.legend()
plt.grid()
plt.title('Foreign Visitors')
plt.show()

トレンドとして前後6ヶ月の移動平均を取ることにした。これをrolling(window=13).mean()とshift(-6)で処理している。
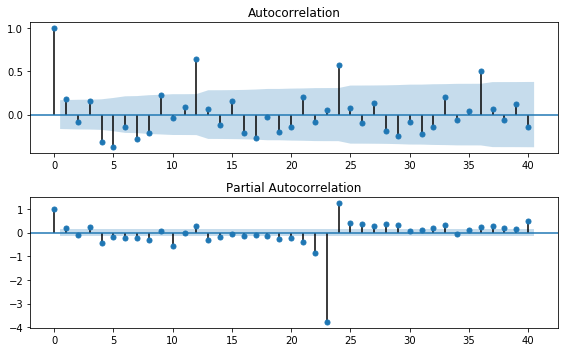
まずは自己相関と偏自己相関を見る。ライブラリを使うと非常に簡単。
fig = plt.figure(figsize=(8,5))
ax1 = fig.add_subplot(211)
fig = sm.graphics.tsa.plot_acf(v['residual'].dropna().values, lags=40, ax=ax1)
ax2 = fig.add_subplot(212)
fig = sm.graphics.tsa.plot_pacf(v['residual'].dropna().values, lags=40, ax=ax2)
plt.tight_layout()
fig.show()
隠しきれない強い季節性が。。。12ヶ月ごとの相関が非常に強いです。
statsmodelsのarma_order_select_icを使うとARMAモデルの最適な次数を推定してくれます。
詳細はこちらのリンク先へ(https://www.statsmodels.org/dev/generated/statsmodels.tsa.stattools.arma_order_select_ic.html)
sm.tsa.arma_order_select_ic(v['residual'].dropna().values, max_ar=4, max_ma=2, ic='aic')
ここでは$ARMA(p,q)$について、デフォルト通り$p$の最大値を4、$q$の最大値を2として、AIC基準を用いています。
| 0 | 1 | 2 | |
|---|---|---|---|
| 0 | 3368.221521 | 3363.291271 | 3350.327397 |
| 1 | 3365.779849 | 3348.257023 | 3331.293926 |
| 2 | 3365.724955 | 3349.083663 | 3328.831252 |
| 3 | 3361.660853 | 3347.156390 | 3329.447773 |
| 4 | 3332.100417 | 3290.984260 | 3292.800604 |
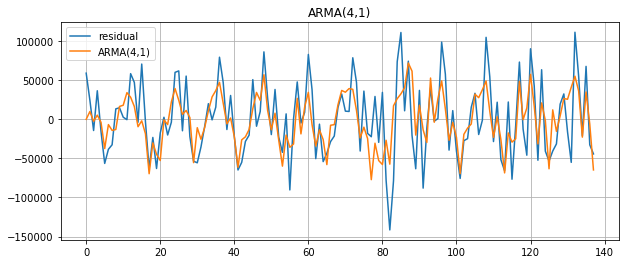
どれもあまり変わらない気がするものの、$p=4,q=1$がいいとの結果に。
arma_model = sm.tsa.ARMA(v['residual'].dropna().values, order=(4,1))
result = arma_model.fit()
plt.figure(figsize=(10,4))
plt.plot(v['residual'].dropna().values, label='residual')
plt.plot(result.fittedvalues, label='ARMA(4,1)')
plt.legend()
plt.grid()
plt.title('ARMA(4,1)')
plt.show()
こんな具合です。
個人的には比較的シンプルなモデルながら結構頑張ってくれてるんじゃないかという気がしました笑

