はじめに
この記事は#30DayMapChallenge2022 15日目の記事です。
テーマはFood/drinkです。
OpenLayersを使ってスターバックスのポイントデータを表示してみます。
OpenLayersとは
簡単にダイナミックなマップを設置することができるJavaScriptライブラリ
地図タイル、ベクトルデータ、マーカーを表示することができる
フリーかつオープンソースで、2条項のBSDライセンス(FreeBSDとしても知られています)の下でリリースされている
執筆時の最新バージョンはv7.1.0でした
ポイントデータを取得する
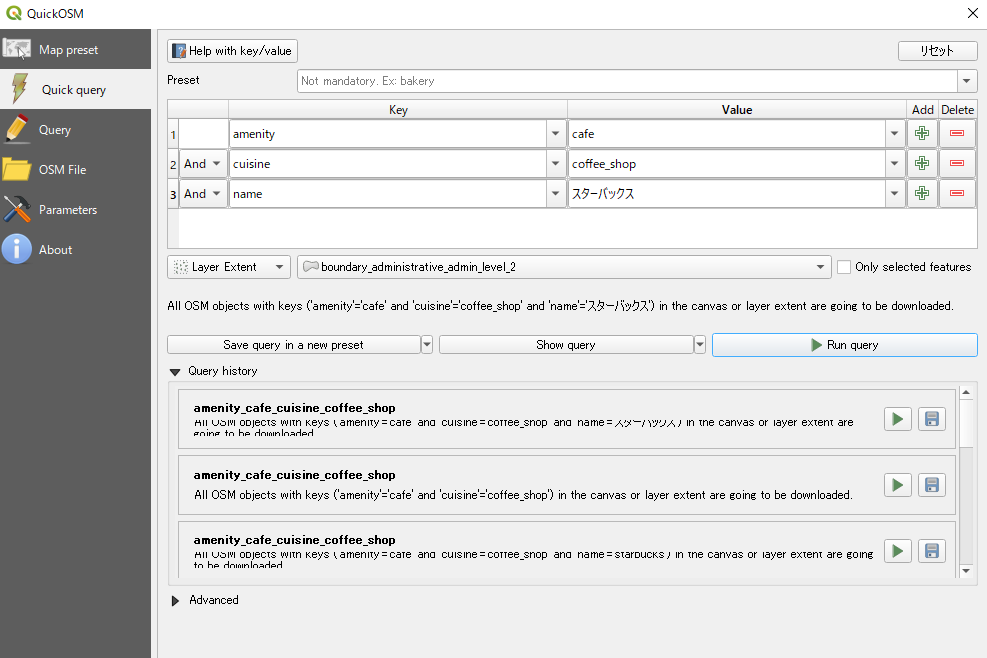
QGISのプラグイン「QuickOSM」を使って日本のスターバックスのポイントデータを取得します。
QuickOSMについてはこちら。
ポイントデータを表示する
index.html
<!DOCTYPE html>
<html lang="ja">
    <head>
        <meta charset="utf-8" />
        <title>サンプル</title>
        <meta name="description" content="サンプルです" />
        <link href="style.css" rel="stylesheet" />
        <!-- OpenLayers -->
        <script src="https://cdn.jsdelivr.net/npm/ol@v7.1.0/dist/ol.js"></script>
        <link rel="stylesheet" href="https://cdn.jsdelivr.net/npm/ol@v7.1.0/ol.css" />
    </head>
    <body>
        <div id="map"></div>
        <script src="main.js"></script>
    </body>
</html>
style.css
body {
    margin: 0;
    padding: 0;
}
#map {
    position: absolute;
    top: 0;
    bottom: 0;
    width: 100%;
}
main.js
const style = {
    Point: new ol.style.Style({
        image: new ol.style.Circle({
            radius: 3,
            stroke: new ol.style.Stroke({
                color: 'rgba(52, 152, 219, 1.0)',
                width: 5,
            }),
            fill: new ol.style.Fill({
                color: 'rgba(52, 152, 219, 0.8)',
            }),
        }),
    }),
};

const styleFunction = function (feature) {
    return style[feature.getGeometry().getType()];
};

const vectorSource = new ol.source.Vector({
    url: 'data/starbucks_point.geojson',
    format: new ol.format.GeoJSON(),
});

const vectorLayer = new ol.layer.Vector({
    source: vectorSource,
    style: styleFunction,
});

const map = new ol.Map({
    layers: [new ol.layer.Tile({ source: new ol.source.OSM() }), vectorLayer],
    view: new ol.View({
        center: ol.proj.transform([139.68786, 35.68355], 'EPSG:4326', 'EPSG:3857'),
        zoom: 6,
    }),
    target: 'map',
});
ポイントデータのスタイルを定義します(今回はサークルにしました)
GeoJSONを読み込み、スタイルを設定します。
Mapオブジェクトに作成したレイヤを追加します。
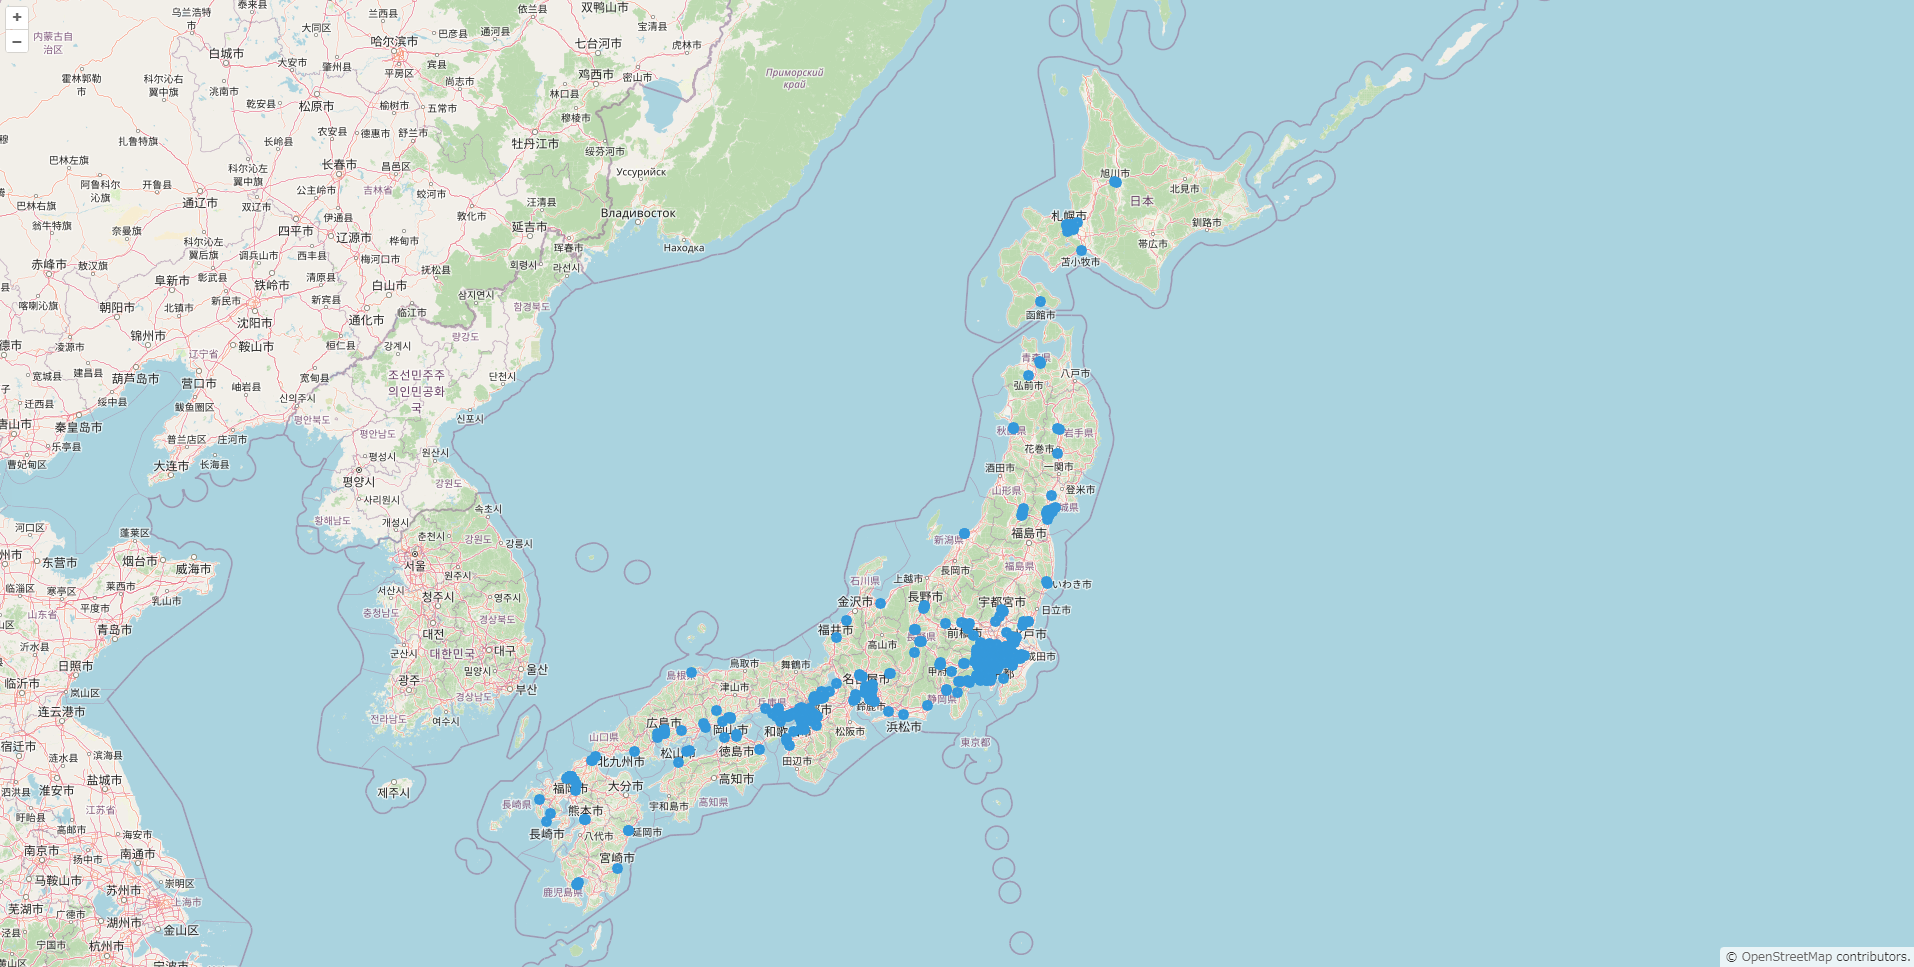
ポイントデータを表示できました!
LeafletやMaplibre GL JSよりもコードが複雑になります。。
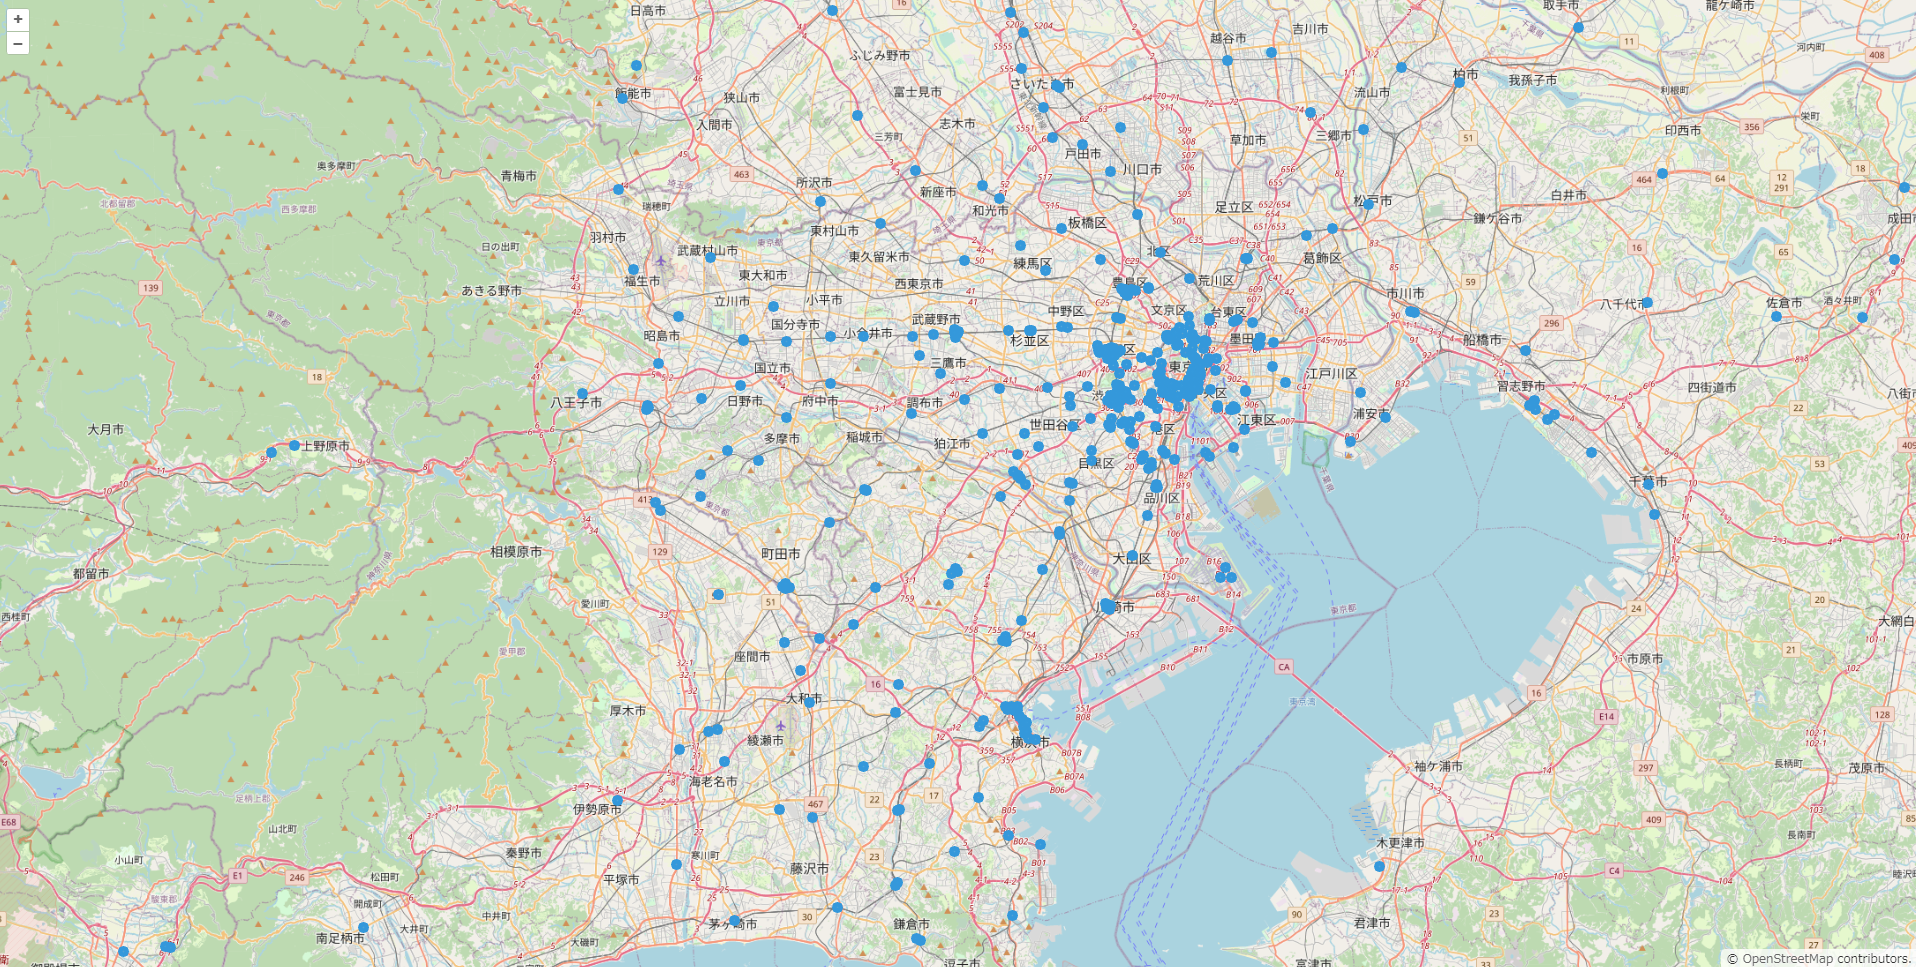
やはり首都圏はスターバックスが多いですね~
参考文献