はじめに
この記事は#30DayMapChallenge2022 23日目の記事です。
テーマはMovementです。
MapLibre GL JSを使ってアイコンにアニメーションを追加してみます。
アイコンにアニメーションを追加する
公式のサンプルコードを参考に実装します。
11日目:Colour Friday: Red で使った「赤」がつく駅名のGeoJSONファイルを使います。
index.html
<!DOCTYPE html>
<html lang="ja">
    <head>
        <meta charset="utf-8" />
        <title>サンプル</title>
        <meta name="description" content="サンプルです" />
        <link href="style.css" rel="stylesheet" />
        <!-- MapLibre -->
        <script src="https://unpkg.com/maplibre-gl@2.4.0/dist/maplibre-gl.js"></script>
        <link href="https://unpkg.com/maplibre-gl@2.4.0/dist/maplibre-gl.css" rel="stylesheet" />
    </head>
    <body>
        <div id="map"></div>
        <script src="main.js"></script>
    </body>
</html>
style.css
body {
    margin: 0;
    padding: 0;
}
#map {
    position: absolute;
    top: 0;
    bottom: 0;
    width: 100%;
}
main.js
var map = new maplibregl.Map({
    container: 'map',
    style: 'https://tile.openstreetmap.jp/styles/osm-bright-ja/style.json', // 地図のスタイル
    center: [139.74019, 35.6642], // 中心座標
    zoom: 14, // ズームレベル
    pitch: 0, // 傾き
});

var size = 200;

// アイコンのアニメージョンの設定
var pulsingDot = {
    width: size,
    height: size,
    data: new Uint8Array(size * size * 4),

    onAdd: function () {
        var canvas = document.createElement('canvas');
        canvas.width = this.width;
        canvas.height = this.height;
        this.context = canvas.getContext('2d');
    },

    render: function () {
        var duration = 1000;
        var t = (performance.now() % duration) / duration;

        var radius = (size / 2) * 0.3;
        var outerRadius = (size / 2) * 0.7 * t + radius;
        var context = this.context;

        context.clearRect(0, 0, this.width, this.height);
        context.beginPath();
        context.arc(this.width / 2, this.height / 2, outerRadius, 0, Math.PI * 2);
        context.fillStyle = 'rgba(255, 200, 200,' + (1 - t) + ')';
        context.fill();

        context.beginPath();
        context.arc(this.width / 2, this.height / 2, radius, 0, Math.PI * 2);
        context.fillStyle = 'rgba(255, 100, 100, 1)';
        context.strokeStyle = 'white';
        context.lineWidth = 2 + 4 * (1 - t);
        context.fill();
        context.stroke();

        this.data = context.getImageData(0, 0, this.width, this.height).data;

        map.triggerRepaint();

        return true;
    },
};

map.on('load', function () {
    map.addImage('pulsing-dot', pulsingDot, { pixelRatio: 2 });
    map.addSource('red_station', {
        type: 'geojson',
        data: './data/red_station.geojson',
        attribution: '国土数値情報(鉄道データ)',
    });
    map.addLayer({
        id: 'red_station',
        type: 'symbol',
        source: 'red_station',
        layout: {
            'icon-image': 'pulsing-dot',
            'icon-size': 0.7,
            'text-field': ['get', 'station'],
            'text-font': ['Open Sans Semibold', 'Arial Unicode MS Bold'],
            'text-offset': [0, 1.2],
            'text-anchor': 'top',
        },
    });
});
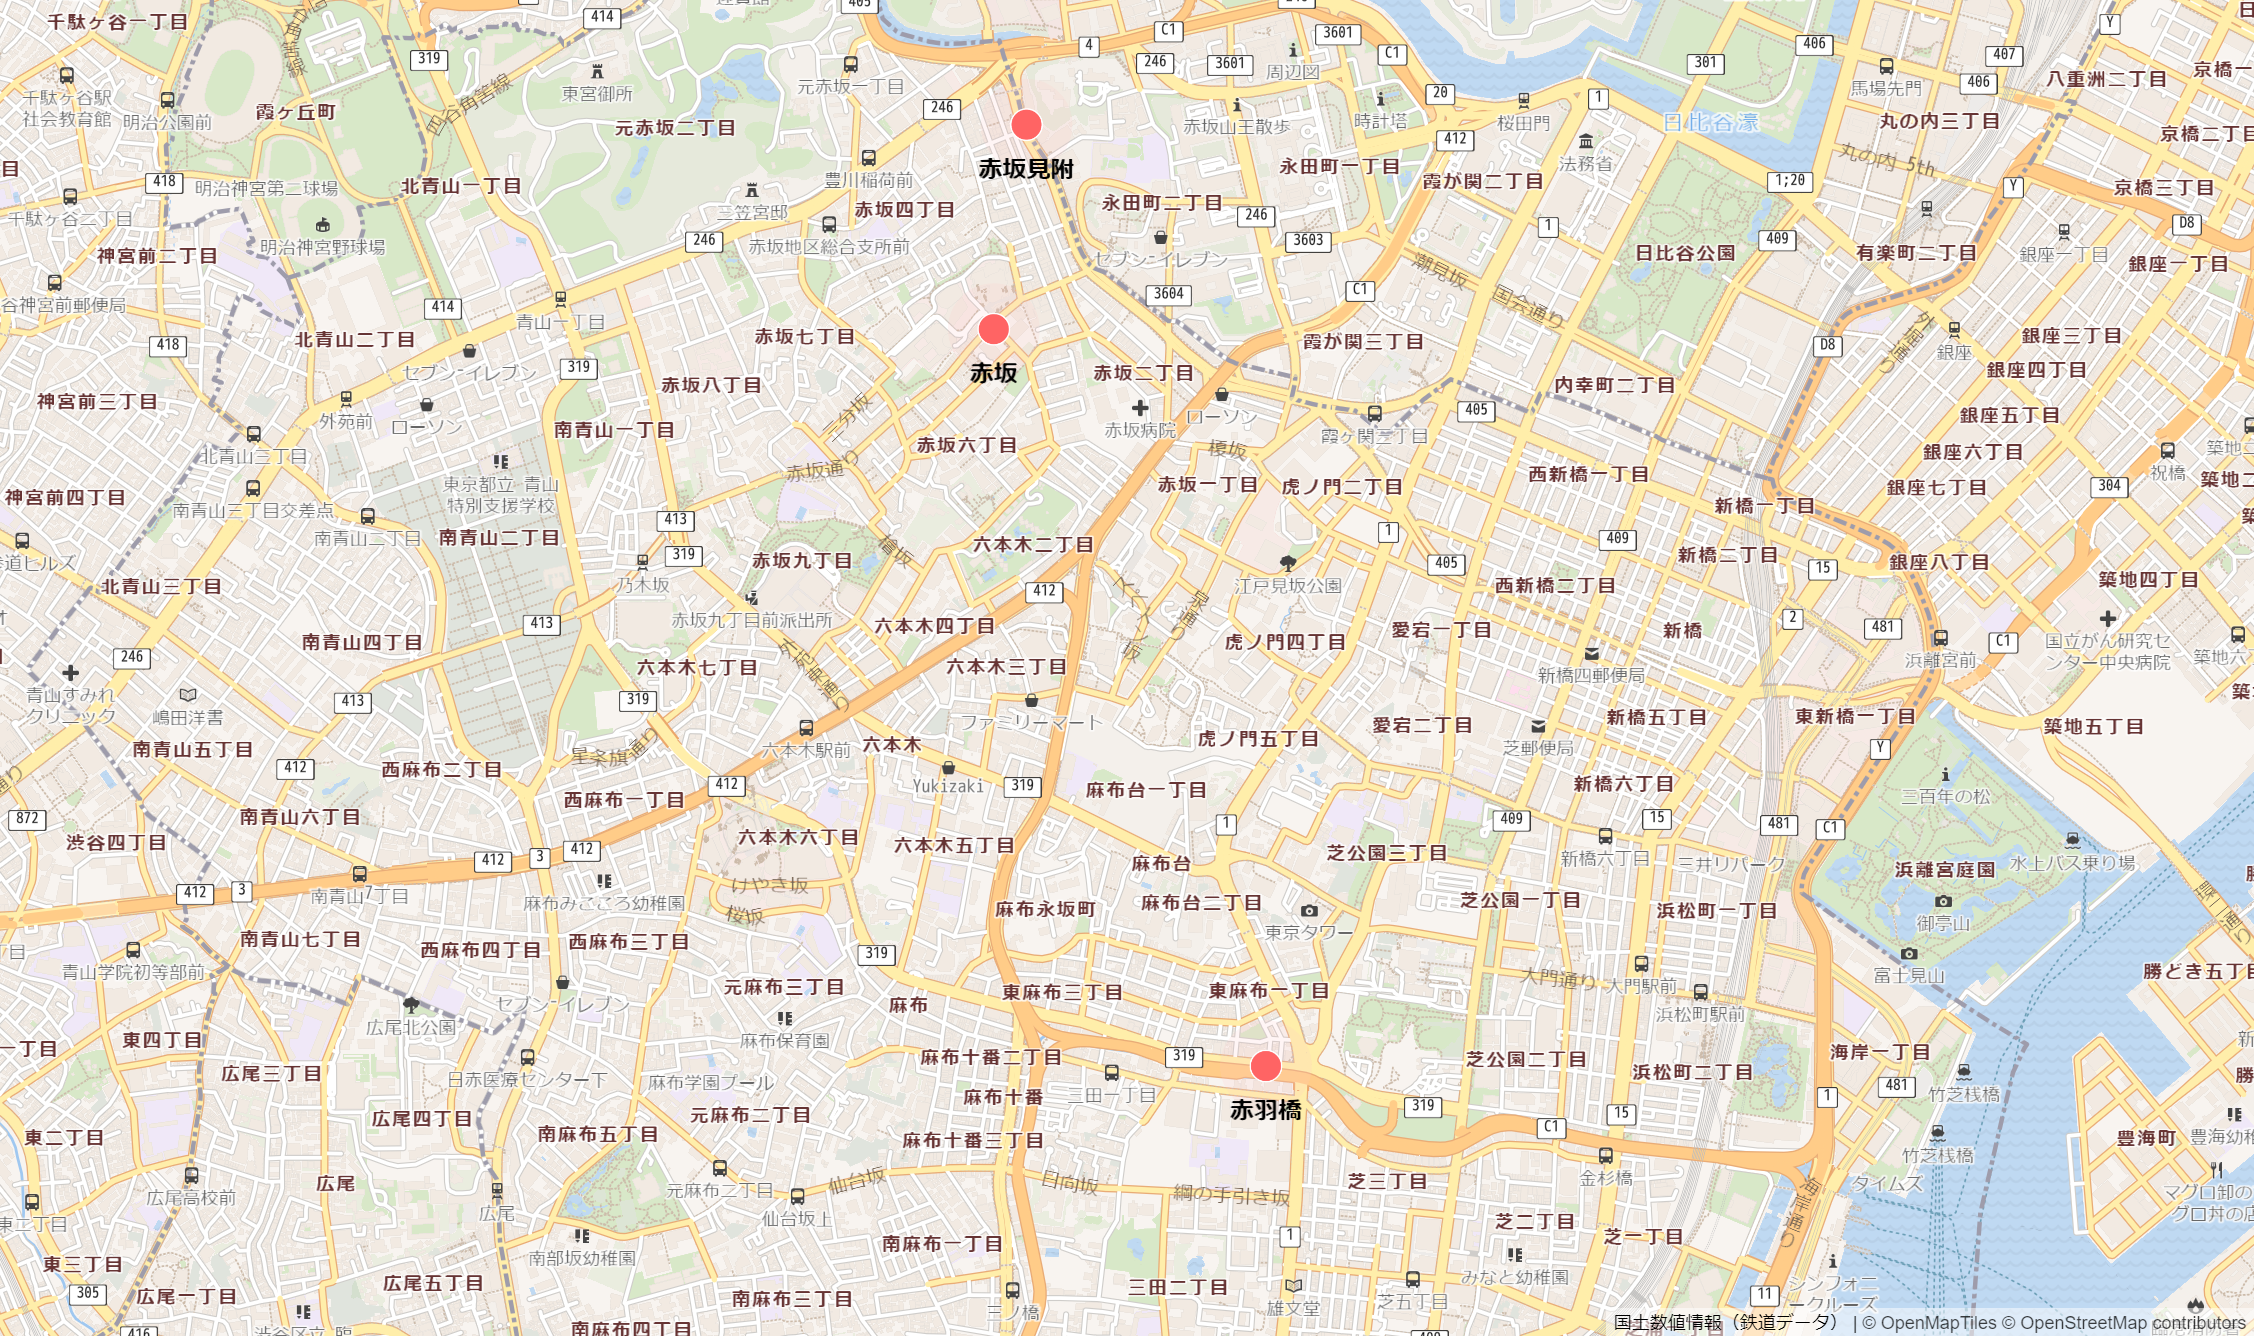
アイコンにアニメーションを付けることができました!
かっこよくなっていいですね~
参考文献