はじめに
この記事は#30DayMapChallenge2022 11日目の記事です。
テーマはColour Friday: Redです。
QGISを使って「赤」が入った駅名データを抽出して、MapLibre GL JSで地図上に表示してみます。
QGISとは
フリーでオープンソースの地理情報システム
ほとんどのUnixプラットフォーム、Windows、macOS上で動作する
事前準備
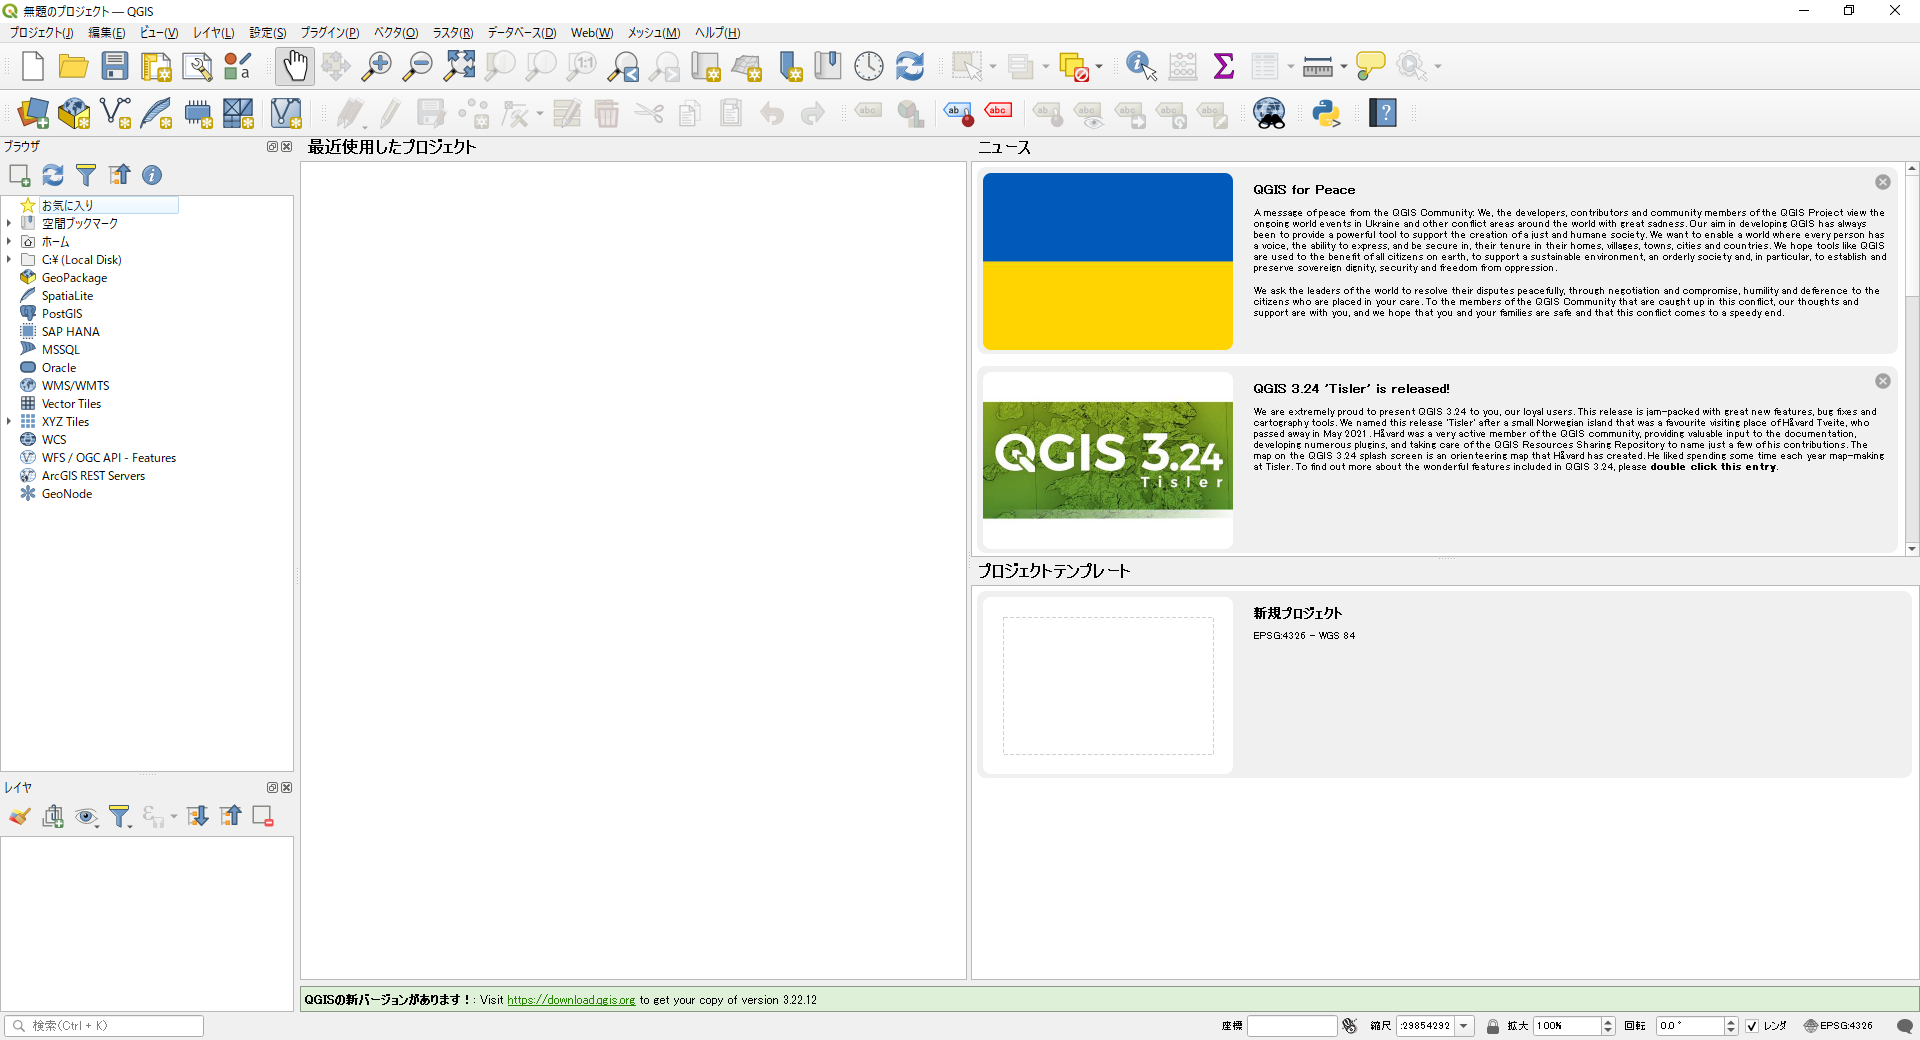
既にインストール済みのQGIS(バージョン3.22.3)を使います。
QGISを開きます。
GISデータから欲しいデータを抽出
国土数値情報の鉄道データを利用します。
駅のデータはポイントデータがよかったのですがラインデータでした。。
Line to Point処理済の駅のポイントデータを頂いたので、今回はそれを使いました。
Thanks! @bordoray
駅のポイントデータをドラッグ&ドロップで読み込みます。
レイヤを右クリックして、「フィルタ」をクリックします。

フィルタの条件を入力します。
今回は、駅名に「赤」が入ったデータを抽出したいので、LIKEを使って文字列の部分一致検索をしました。
「テスト」をクリックすると、データが何件返ってくるか確認できます。

OKをクリックすると、フィルタされたデータが表示されます。

フィルタされた状態のGISデータを出力するには、レイヤを右クリックして、「エクスポート」>「新規ファイルに地物を保存」をクリックします。
MapLibre GL JSで抽出したデータを表示
鉄道の路線と「赤」がつく駅をMapLibre GL JSで表示してみます。
路線はオレンジっぽい色で、駅は赤色にしてみました。
初期表示時は日本全体が移るようにして、ジャンプボタンを押すと東京にズームするようにしてみました。
ズームレベルに応じて、駅のデータをサークル(丸)からアイコンに変化するようにしてみました。
'text-field' オプションを使って、駅のアイコンの下に駅名が出るようにしました。
<!DOCTYPE html>
<html lang="ja">
    <head>
        <meta charset="utf-8" />
        <title>サンプル</title>
        <meta name="description" content="サンプルです" />
        <link href="style.css" rel="stylesheet" />
        <!-- MapLibre -->
        <script src="https://unpkg.com/maplibre-gl@2.4.0/dist/maplibre-gl.js"></script>
        <link href="https://unpkg.com/maplibre-gl@2.4.0/dist/maplibre-gl.css" rel="stylesheet" />
    </head>
    <body>
        <div id="map"></div>
        <button id="fly">東京へジャンプ!</button>
        <script src="main.js"></script>
    </body>
</html>
body {
    margin: 0;
    padding: 0;
}
#map {
    position: absolute;
    top: 0;
    bottom: 0;
    width: 100%;
}

#fly {
    display: block;
    position: relative;
    margin: 30px auto;
    width: 15%;
    height: 50px;
    padding: 10px;
    border: none;
    border-radius: 50px;
    font-size: 20px;
    text-align: center;
    color: #fff;
    background: red;
    cursor: pointer;
}
#fly:hover {
    transform: scale(1.1, 1.1);
}
const tokyo_location = [139.74019, 35.6642];
const start_location = [136.29, 38.84];

var map = new maplibregl.Map({
    container: 'map',
    style: 'https://basemaps.cartocdn.com/gl/dark-matter-nolabels-gl-style/style.json', // 地図のスタイル
    center: start_location, // 中心座標
    zoom: 5, // ズームレベル
    pitch: 0, // 傾き
});

map.on('load', function () {
    map.addSource('railroad', {
        type: 'geojson',
        data: './data/railroad.geojson',
    });
    map.addLayer({
        id: 'railroad',
        type: 'line',
        source: 'railroad',
        minzoom: 0,
        layout: {
            'line-join': 'round',
            'line-cap': 'round',
        },
        paint: {
            'line-color': '#ee7800',
            'line-opacity': 0.7,
            'line-width': 1.5,
        },
    });
    map.loadImage('./data/station.png', function (error, image) {
        if (error) throw error;
        map.addImage('station_icon', image);
    });
    map.addSource('red_station', {
        type: 'geojson',
        data: './data/red_station.geojson',
        attribution: '国土数値情報(鉄道データ)',
    });
    map.addLayer({
        id: 'red_station',
        type: 'symbol',
        source: 'red_station',
        minzoom: 6,
        layout: {
            'icon-image': 'station_icon',
            'icon-size': 0.15,
            'text-field': ['get', 'station'],
            'text-font': ['Open Sans Semibold', 'Arial Unicode MS Bold'],
            'text-offset': [0, 1.2],
            'text-anchor': 'top',
        },
        paint: {
            'text-color': '#ffffff',
        },
    });
    map.addLayer({
        id: 'red_station_circle',
        source: 'red_station',
        maxzoom: 6,
        type: 'circle',
        paint: {
            'circle-radius': 4,
            'circle-color': 'red',
        },
    });
});

document.getElementById('fly').addEventListener('click', function () {
    map.flyTo({
        center: tokyo_location,
        zoom: 14,
        bearing: 0,
        speed: 1.1,
        curve: 1.42,
        easing: function (t) {
            return t;
        },
        essential: true,
    });
});

赤っぽい地図になりましたね~
参考文献